In Power BI, the Row Context and Filter Context govern how calculations and interactions are performed within the data model. Row context and Filter context are specifically useful to understand and implement Data Analysis Expressions(DAX) properly. This article covers Row Context and Filter Context in Power BI, along with examples for a better understanding of the concept.
Row Context and Filter Context in DAX
Data Analysis Expressions (DAX) is a programming language that is used throughout Microsoft Power BI for creating calculated columns, measures, and custom tables. In the example of Row Context, the DAX function, SUMX, is used to calculate the measure by iterating row by row. In the example of Filter Context, the DAX function, CALCULATE, is used.
What is Row Context in Power BI
Row Context refers to the calculations and evaluation of values for each individual row and the values for the corresponding columns with respect to the current row. For example, if we have a Financial Data table, where there are two columns namely Units Sold and Price per Unit. Then a measure called Total Price can be calculated as follows:
Total Price = (Price per Unit) * (Units Sold)
The Row Context allows the measure, Total Price, to perform calculations based on the specific values in each row, such as multiplying the Price per Unit by the Units Sold in the current row.
What is Filter Context in Power BI
Filter context refers to the set of filters applied to the data when performing calculations in Power BI. It determines which subset of data is included or excluded before the DAX calculations start, based on the active filters at any given time. As the active filter changes, calculations adjust dynamically. The filter context is applied to the entire measure, and the visibility of certain rows is restricted based on the active filters at the time.
For example, if we take into account the above measure, Total Price, and we apply a filter to show data only for a specific product, the filter context is modified to include only the data related to that product. The Total Price measure will then be computed based on the filtered data, providing the information specific to the selected product.
Difference Between Row Context and Filter Context
Thus, from the above discussions on Row Context and Filter Context, it can be inferred that, if row-by-row calculations or calculations related to one row at a time are taken into account, then it is Row Context. Whereas, if calculations on a set of rows are done, where the set of rows is not specific and can change dynamically depending on the active filters at any point in time, then Filter Context is operated.
Row Context and Filter Context in DAX Example
Now let us see an example of Row Context and Filter Context in Power BI.
Row Context in DAX Example
In the dataset, we are provided with the Number of Units Sold, the Cost Price of each unit, and the Selling Price of each unit. Hence with the given data, we can easily calculate the Cost Price, Selling Price, and Profit.
To calculate the Cost Price of each product, the following formula is used
 The formula of Cost Price of each product
To calculate the Selling Price of each product, the following formula is used
 The formula of the Selling Price of each product
To calculate the Profit of each product, the following formula is used
 The formula of Profit of each product
Note: It is to be noted that here that SUMX is used instead to SUM as the Selling Price, Cost Price, and Profit are, calculated for each row. SUMX iterates row by row the formula inside its function whereas SUM would have calculated the aggregate of values for the whole column.
Demonstration of Row Context on the Dashboard with the help of Profit Measure
Now let us make a dashboard using Profit measure and let us see Total Profit is calculated for each row and for the whole column:
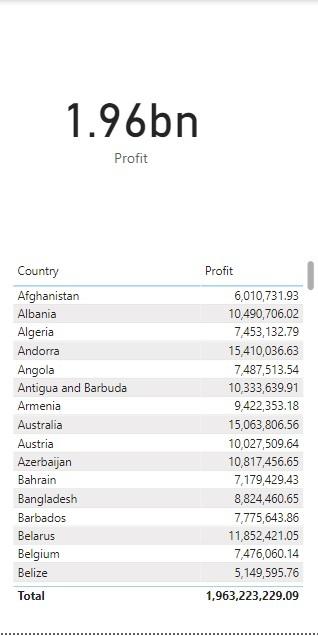 Figure 1: Profit for Countries under Region Asia and Sales Channel as Offline
 Figure 2: Profit calculated for each Region and Order Priority row-wise
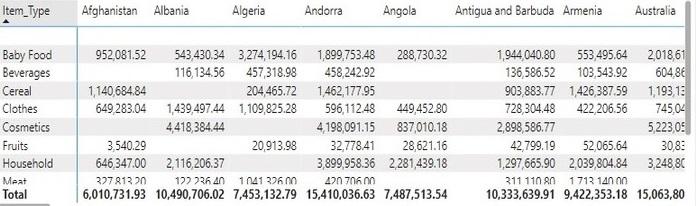 Figure 3: The value in each row specifies Profit in each region according to Item Type
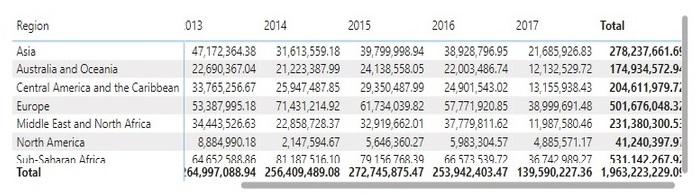 Figure 4: The value in each row specifies the Yearly Profit for each Region
From the above Figures, it can be seen that Total Profit is calculated both row-wise as well as column-wise.
Filter Context in DAX Example
By using Filter Context, it can be shown how the Total Profit as a whole and also row-wise as well as column-wise changes as the active filter changes, thus revealing the dynamic nature of this context. First, the Construction of a Dashboard with filters Region as Asia and Sales Channel as Offline
 Figure 1: Profit for Countries under Region Asia and Sales Channel as Offline
 Figure 2: Profit according to Order Priority for the Asia Region and Offline Sales Channel
.png) Figure 3: Profit of each Item Type for countries under Region Asia and Sales Channel Offline
Figure 3: Profit of each Item Type for countries under Region Asia and Sales Channel Offline
 Figure 4: Yearly Profit for Asia Region under Offline Sales Channel
From the above Figures, it can be seen that the Total Profit has also changed after the filter conditions have been applied. Since the Region chosen has been Asia, only Countries under Asia whose Sales Channel is Offline are Shown. The total Profit for each Country under Asia is shown. Profit of Asia under the Offline channel for each year can be seen. Other Regions in the Region and Year table have been excluded, thus restricting their visibility. Total Profit of 139.34 M is in respect to Asia with Offline sales.
Thus, an important point to note here that is if Row Context and Filter Context are to be used simultaneously, then first the Filter Context will be executed. Depending on the filter conditions, the Row Context will be executed after that.
CALCULATE Function in Filter Context
If CALCULATE function is used, then it will overwrite all the internal filters, and only the filter specified in the function will be executed. The external filters will be still executed. Let us understand it with an example.
Example of CALCULATE Function
Let us calculate a measure called Asia Products, where the Total Number of Units Sold in Asia will be calculated. Here the internal filter will be the Region Asia. The formula for CALCULATE is as follows:
Step 1: Calculation of Total Number of Units Sold in Asia with CALCULATE Function
 Calculating the Total Number of Units Sold only in the Asia Region with the help of CALCULATE function
Step 2: Demonstration of CALCULATE Function on the Dashboard
Now let us design a dashboard with the measure calculated.
 Figure 1: The column Asia Products shows the Sum of Units Sold only in the Asia region
Here with the help of CALCULATE function, the Total Number of Units Sold with respect to Region Asia is calculated. As can be seen from the column Asia Products, the total number of units sold in Asia is shown for all the rows irrespective of the Region. Hence if there would have been other Region filters, it has been overwritten with Region as Asia filter.
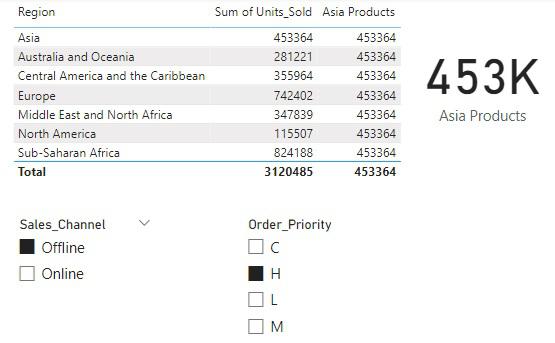 Figure 2: CALCULATE function with external filters Sales Channel Offline and Order Priority H
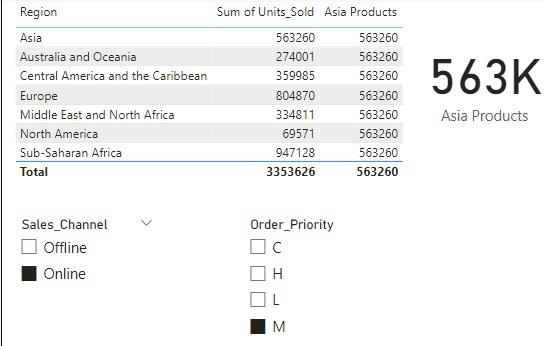 Figure 3: CALCULATE function with Sales Channel Online and Order Priority M
Thus, it can be seen that the Total Number of Units Sold in Asia changes only when the external filters namely, Sales_Channel and Order_Priority change. Hence CALCULATE function overwrites the internal filter, but doesn’t have any impact on external filters.
Conclusion
Understanding and managing both Row Context and Filter Context is essential for accurate calculations and meaningful data analysis in Power BI. By leveraging these contexts effectively, one can create calculations that consider individual row values and dynamically respond to user interactions through applied filters.
Please Login to comment...