Open In App

Total in a crosstab by column in Tableau

Last Updated : 01 Oct, 2020
Improve
Improve
Like Article
Like
Save
Share
Report

In this article, we will learn how to calculate the total in a crosstab by column in tableau worksheet to do further operations. For this first look into two terms :

  • Tableau: Tableau is a very powerful data visualization tool that can be used by data analysts, scientists, statisticians, etc. to visualize the data and get a clear opinion based on the data analysis. Tableau is very famous as it can take in data and produce the required data visualization output in a very short time.
  • Crosstab: A crosstab may be defined as the data in form of a table with a cross(merging). In Tableau, the crosstab is the data representation with some attributes.

Dataset used in the given examples is Dataset.

For this we have to follow some steps :

Open the Tableau tool and connect a dataset into it. Drag and drop the one sheet of the connected dataset. Click on sheet1 to open the tableau worksheet. On clicking Sheet1 you will get whole dataset attributes on the left side and a worksheet for work

To calculate total you have to cross tab by drag and drop ans select the chart option as crosstab.

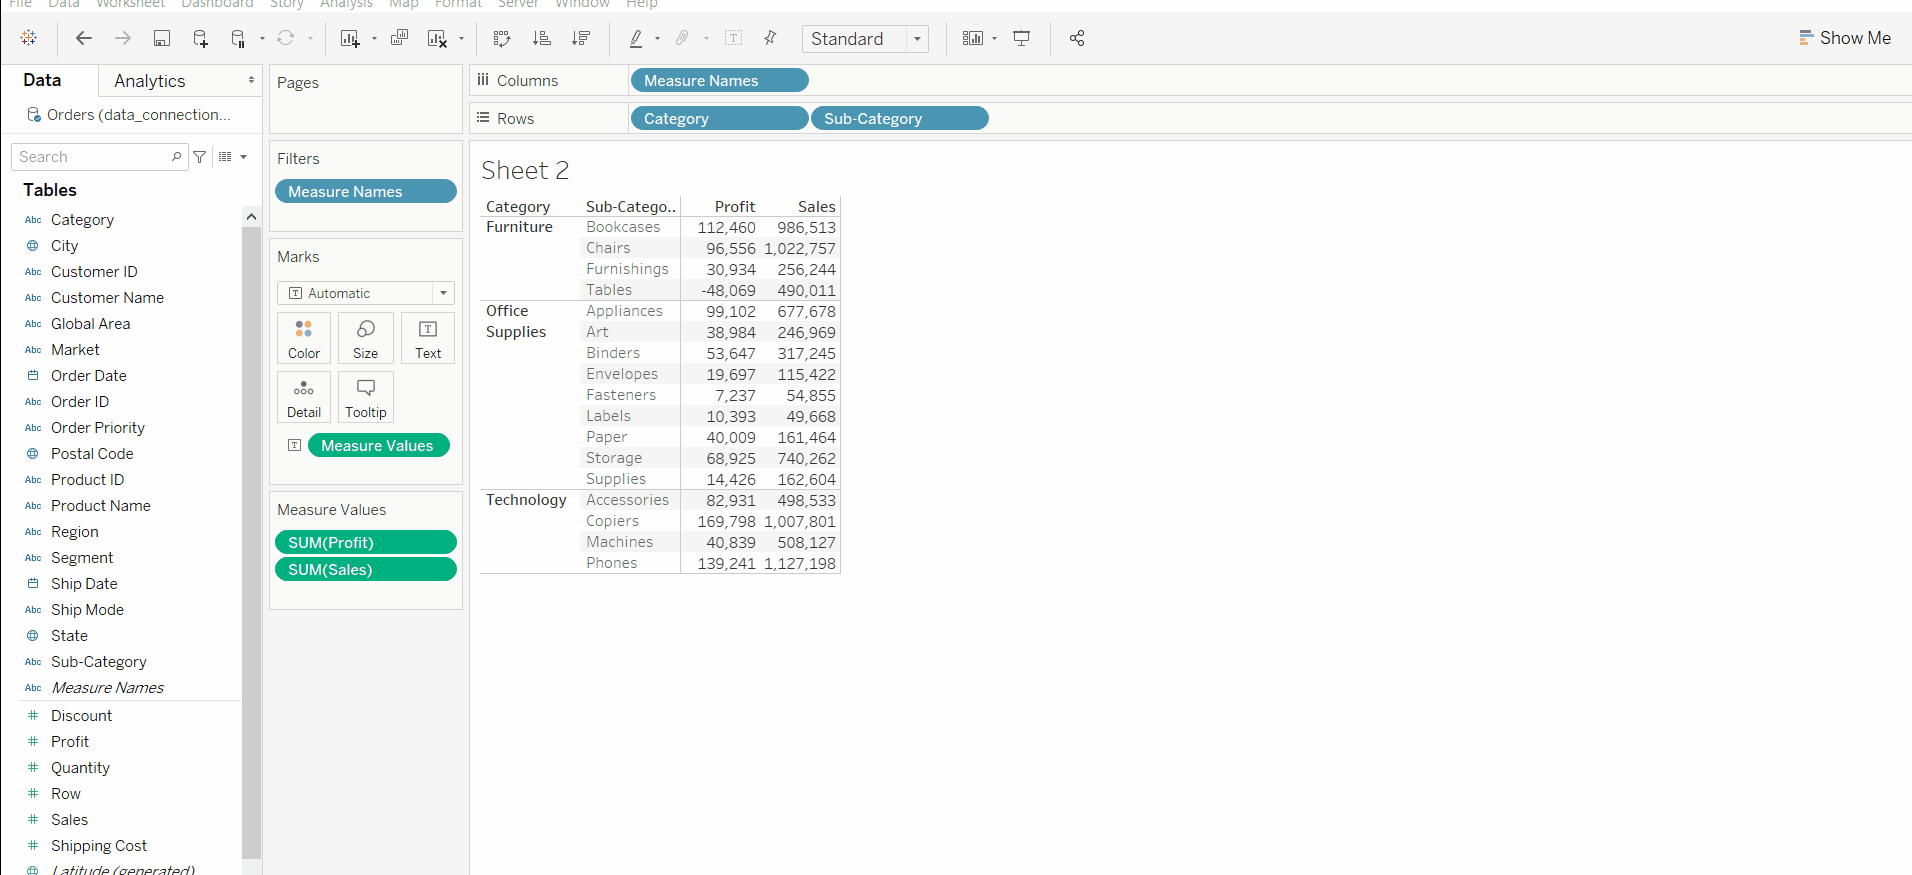
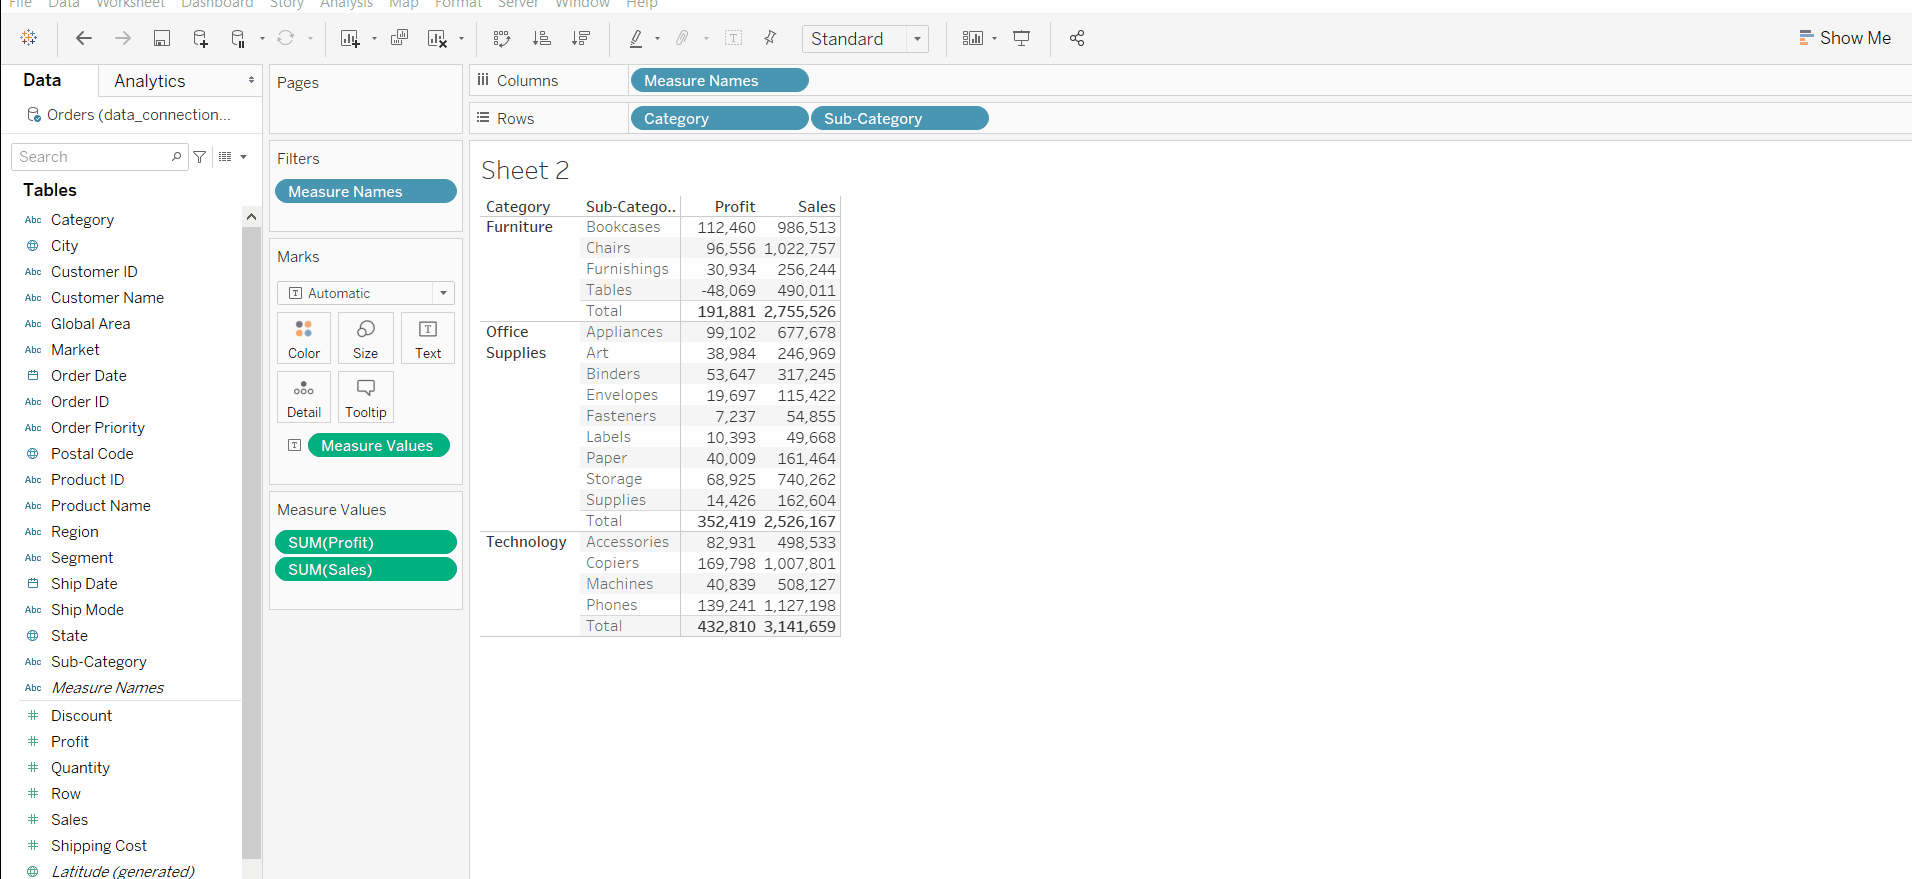
Example 1: In this example, we add all subtotals.

Example 2: In this example, we calculated the grand total of columns.

Example 3: In this example we remove all subtotals.

Example 4: In this example, we add all subtotals and change the function used for the total.

Example 5: In this example, we add all subtotals then arrange the total at the top.


Previous Article
Next Article

Similar Reads

Crosstab in tableau
In this article we will learn how to form a crosstab in tableau worksheet to do further operations. For this first look into two terms : Tableau : Tableau is a very powerful data visualization tool that can be used by data analysts, scientists, statisticians, etc. to visualize the data and get a clear opinion based on the data analysis. Tableau is
2 min read
Tableau Public vs Tableau Desktop
Tableau is a powerful data visualization tool with one of the fastest, most robust, and rapidly expanding data visualization solutions. It assists in converting raw data to a format that is very simple to interpret. Tableau facilitates the creation of data that can be comprehended by experts at all organizational levels. Additionally, it enables no
2 min read
Tableau - Navigation
Tableau is the easy-to-use Business Intelligence tool used in data visualization. Its unique feature is, to allow data real-time collaboration and data blending, etc. Through Tableau, users can connect databases, files, and other big data sources and can create a shareable dashboard through them. Tableau is mainly used by researchers, professionals
5 min read
Replacing data source in Tableau
Tableau is a commercially available software used in business intelligence to visualize data interactively and understand and deal with it better. It is used for data analysis to finally help draft plans or inferences a company may need to understand themselves. A data source in the tableau is a collection of tables which can be analyzed together a
1 min read
Image Object on Dashboard in Tableau
In this article we will learn how to use Image Object on dashboard in tableau. For this first look into two terms : Tableau : Tableau is a very powerful data visualization tool that can be used by data analysts, scientists, statisticians, etc. to visualize the data and get a clear opinion based on the data analysis. Tableau is very famous as it can
2 min read
Tableau Drivers - Download and Connect
When working on Tableau, one of the befits a user can have is the option and ease to connect with many different types of data sources. If the user is working on the Tableau desktop edition, then it provides built-in connectivity to the different types of data sources. One can clearly see many different options available to the left side under the
1 min read
Tableau Installation Guide
Tableau is a free software that allows user to easily create amazing and interactive visualisations and that too without any programming. Using this tool, one can simplify raw data into a much understandable form. Being easy and powerful, Tableau is a very popular data visualization tool in the Business industry. One can connect to the authors arou
2 min read
Tableau - File System
Although it is very easy to use Tableau, there is a lot going behind the scene. There are many different file types that support the smooth working of Tableau. This structure of files makes it easy and reliable to perform the visualisation tasks. The types of Tableau files are listed as - Tableau Workbook (.twb): These kind of files stores visualiz
2 min read
Tableau - Connect to a data source
Visualisation in Tableau starts with connecting to an outside data source. This article explains how to connect Tableau to any external data source. Steps to follow - Run Tableau. On the left side of the start screen, there is a Connect Panel. Go to the File Section and choose the type of data file you want. Let's choose any excel file. On clicking
1 min read
Difference Between Google Data Studio vs Tableau
Data visualization is an integral part used for digital marketing and digital analytics market in today's world. Interactive data visualization, that comprises of the ease of use, simplified communication among the company’s various departments, and the power to concise huge amount of data into convenient and easy-to-read visuals. Both Google Data
2 min read
Article Tags :