Adding table within the plotting region of a ggplot in R
Last Updated :
24 Jun, 2021
In this article, we are going to see how to add the data frame table in the region of the plot using ggplot2 library in R programming language.
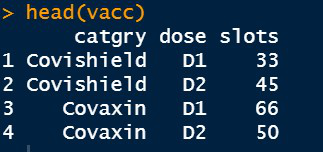
Dataset in use:
Here we are plotting a scatterplot, the same can be done for any other plot. To plot a scatter plot in ggplot2, we use the function geom_point( ).
Syntax:
geom_point(mapping=NULL, data=NULL, stat=”identity”, position=”identity”,…)
Parameter:
- size : To assign size to the points.
- shape : To assign the shape, ggplot2 library has various shapes which are assigned with a numeric value ranging in [0,25].
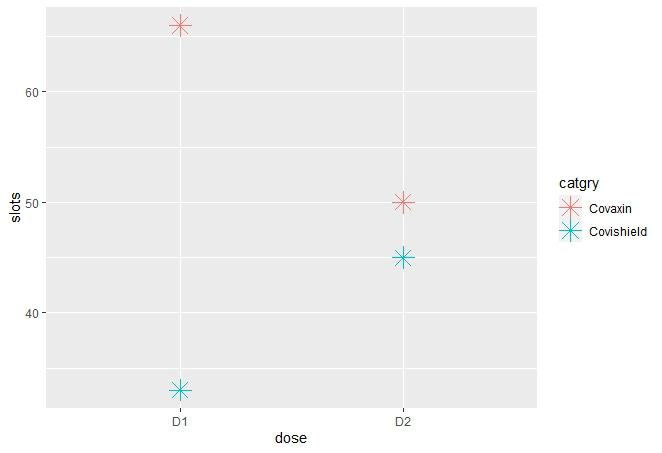
Let us first draw a regular plot without a table, so that the difference is apparent.
Example:
R
library(ggplot2)
vacc <- data.frame(catgry=rep(c("Covishield", "Covaxin"), each=2),
dose=rep(c("D1", "D2"),2),
slots=c(33, 45, 66, 50))
plt <- ggplot(vacc, aes(dose, slots, color = catgry))+
geom_point(shape=8,size = 5)
plt
|
Output:
To add table to the plot first we create the table using the cbind(). Now we annotate the table using the function annotate(). It is used to specify the location of the table in the ggplot.
Syntax:
annotate(geom,x,y,xmin,xmax,ymin,ymax,label,vjust,hjust,….)
Parameters :
- geom : The name of the geom which is table here for which annotation has to be done
- x,y,xmax,ymax,xmin,ymin : Any two of these has to be mentioned in order to set the location of table in plot.
- label : Label is the ggp_table here which we want to add in the region of plot.
- vjust, hjust : Setting the horizontal and vertical adjust of the table
Before proceeding further we need to install and load another library in R named ggpmisc which stands to Miscellaneous Extensions to ggplot. To install and load write the below command in R Console :
install.packages(“ggpmisc”)
library(ggpmisc)
This library is helpful to put the table in the plot region using the keyword :
geom=”table” // inside the annotate function
Example:
R
library(ggplot2)
library(ggpmisc)
vacc <- data.frame(catgry=rep(c("Covishield", "Covaxin"), each=2),
dose=rep(c("D1", "D2"),2),
slots=c(33, 45, 66, 50))
head(vacc)
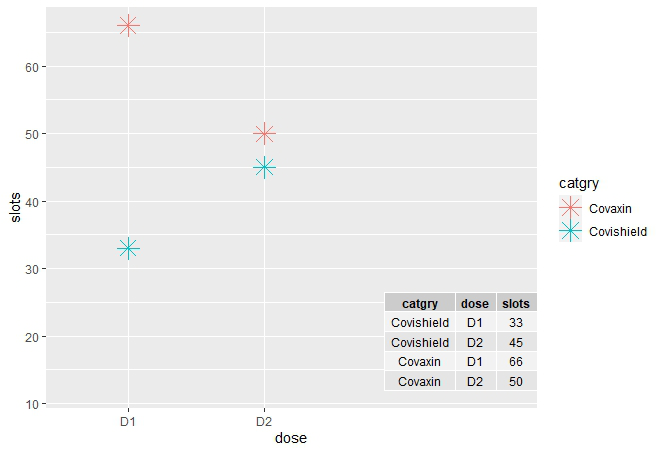
ggplot(vacc, aes(dose, slots, color = catgry))+
geom_point(shape=8,size = 5)+ annotate(geom = "table",x = 4,y = 12,
label = list(cbind(vacc)))
|
Output:
Like Article
Suggest improvement
Share your thoughts in the comments
Please Login to comment...