Computational Graphs in Deep Learning
Last Updated :
13 May, 2022
Computational graphs are a type of graph that can be used to represent mathematical expressions. This is similar to descriptive language in the case of deep learning models, providing a functional description of the required computation.
In general, the computational graph is a directed graph that is used for expressing and evaluating mathematical expressions.
These can be used for two different types of calculations:
- Forward computation
- Backward computation
The following sections define a few key terminologies in computational graphs.
- A variable is represented by a node in a graph. It could be a scalar, vector, matrix, tensor, or even another type of variable.
- A function argument and data dependency are both represented by an edge. These are similar to node pointers.
- A simple function of one or more variables is called an operation. There is a set of operations that are permitted. Functions that are more complex than these operations in this set can be represented by combining multiple operations.
For example, consider this :  .
.
For better understanding, we introduce two variables d and e such that every operation has an output variable. We now have:


Here, we have three operations, addition, subtraction, and multiplication. To create a computational graph, we create nodes, each of them has different operations along with input variables. The direction of the array shows the direction of input being applied to other nodes.
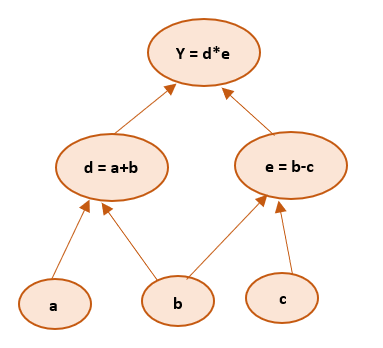
We can find the final output value by initializing input variables and accordingly computing nodes of the graph.
Computational Graphs in Deep Learning
Computations of the neural network are organized in terms of a forward pass or forward propagation step in which we compute the output of the neural network, followed by a backward pass or backward propagation step, which we use to compute gradients/derivatives. Computation graphs explain why it is organized this way.
If one wants to understand derivatives in a computational graph, the key is to understand how a change in one variable brings change on the variable that depends on it. If a directly affects c, then we want to know how it affects c. If we make a slight change in the value of a how does c change? We can term this as the partial derivative of c with respect to a.
Graph for backpropagation to get derivatives will look something like this:
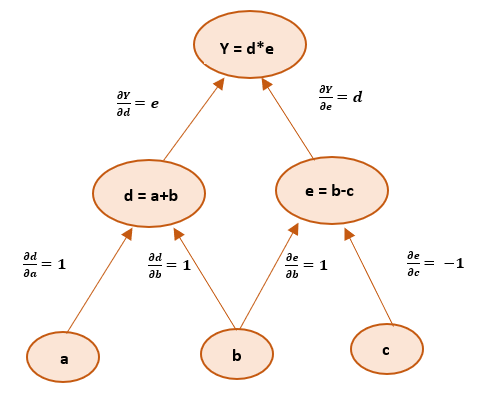
We have to follow chain rule to evaluate partial derivatives of final output variable with respect to input variables: a, b, and c. Therefore the derivatives can be given as :
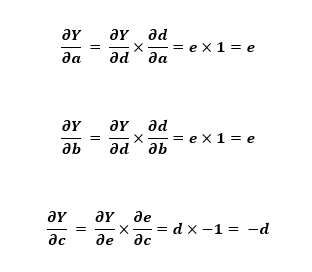
This gives us an idea of how computational graphs make it easier to get the derivatives using backpropagation.
Types of computational graphs:
Type 1: Static Computational Graphs
- Involves two phases:-
- Phase 1:- Make a plan for your architecture.
- Phase 2:- To train the model and generate predictions, feed it a lot of data.
- The benefit of utilizing this graph is that it enables powerful offline graph optimization and scheduling. As a result, they should be faster than dynamic graphs in general.
- The drawback is that dealing with structured and even variable-sized data is unsightly.
Type 2: Dynamic Computational Graphs
- As the forward computation is performed, the graph is implicitly defined.
- This graph has the advantage of being more adaptable. The library is less intrusive and enables interleaved graph generation and evaluation. The forward computation is implemented in your preferred programming language, complete with all of its features and algorithms. Debugging dynamic graphs is simple. Because it permits line-by-line execution of the code and access to all variables, finding bugs in your code is considerably easier. If you want to employ Deep Learning for any genuine purpose in the industry, this is a must-have feature.
- The disadvantage of employing this graph is that there is limited time for graph optimization, and the effort may be wasted if the graph does not change.
Like Article
Suggest improvement
Share your thoughts in the comments
Please Login to comment...