Create Line Curves for Specified Equations in R Programming – curve() Function
Last Updated :
10 Jun, 2020
curve() function in R Language is used to draw a curve for the equation specified in the argument.
Syntax: curve(expression, to, from, col)
Parameters:
expression: To be curved
to, from: range of curve plotting
col: color of curve
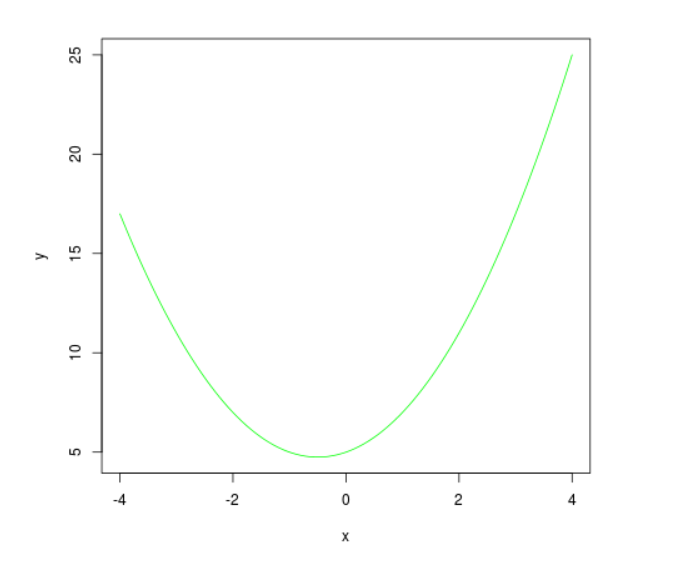
Example 1:
curve(x ^ 2 + x + 5, -4, 4, col ="green", ylab ="y")
|
Output:
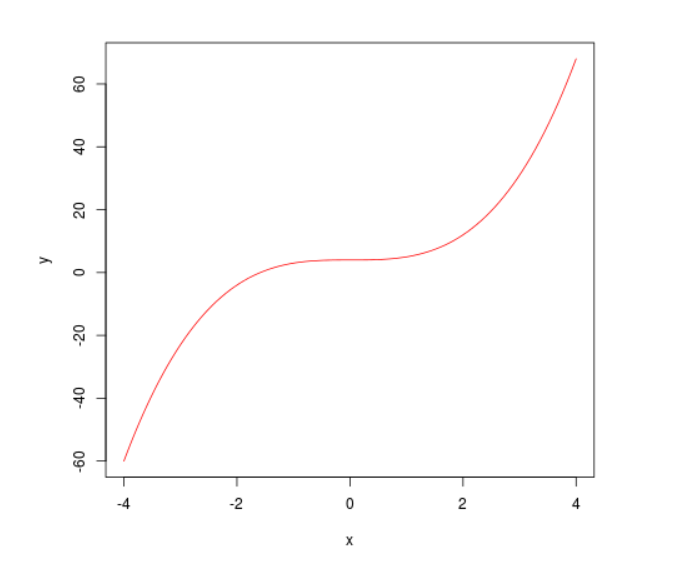
Example 2:
fun <- function(x) {x ^ 3 + 4}
curve(fun, -4, 4, col ="red", ylab ="y")
|
Output:
Like Article
Suggest improvement
Share your thoughts in the comments
Please Login to comment...