Diagrammatic and Graphic Presentation of Data
Last Updated :
06 Apr, 2023
Diagrammatic and graphic presentation of data means visual representation of the data. It shows a comparison between two or more sets of data and helps in the presentation of highly complex data in its simplest form. Diagrams and graphs are clear and easy to read and understand. In the diagrammatic presentation of data, bar charts, rectangles, sub-divided rectangles, pie charts, or circle diagrams are used. In the graphic presentation of data, graphs like histograms, frequency polygon, frequency curves, cumulative frequency polygon, and graphs of time series are used.
General Rules for Construction of Diagrammatic and Graphic Presentations:
1. Chronic Number: Each outline or chart should have a chronic number. It is important to recognize one from the other.
2. Title: A title should be given to each outline or chart. From the title, one can understand what the graph or diagram is. The title ought to be brief and simple. It is normally positioned at the top.
3. Legitimate size and scale: An outline or chart ought to be of ordinary size and drawn with an appropriate scale. The scale in a chart indicates the size of the unit.
4. Neatness: Outlines should be pretty much as straightforward as could be expected. Further, they should be very perfect and clean. They ought to likewise be dropped to check out.
5. File: Each outline or chart should be joined by a record. This outlines various sorts of lines, shades or tones utilized in the graph.
6. Commentary: Commentaries might be given at the lower part of an outline. It explains specific focuses in the chart.
Merits of Diagrammatic and Graphics Presentation:
The fundamental benefits or merits of a diagrammatic and graphical representation of data are as follows:
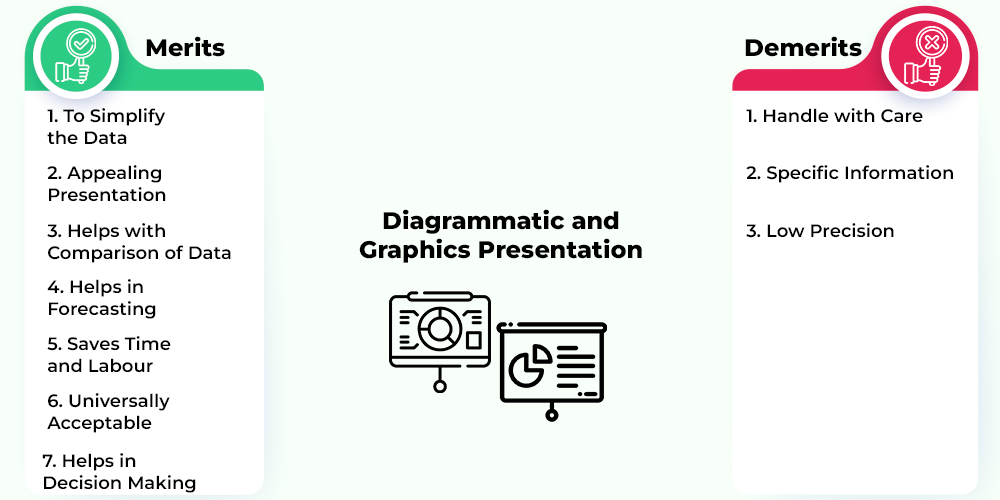
1. To simplify the data: Outlines and charts present information in a simple manner that can be perceived by anyone without any problem. Huge volume of data can be easily presented using graphs and diagrams.
2. Appealing presentation: Outlines and charts present complex information and data in an understandable and engaging manner and leave a great visual effect. In this way, the diagrammatic and graphical representation of information effectively draws the attention of users.
3. Helps with comparison of data: With the help of outlines and charts, comparison and examination data between various arrangements of information is possible.
4. Helps in forecasting: The diagrammatic and graphical representation of information has past patterns, which helps in forecasting and making various policies for the future.
5. Saves time and labour: Charts and graphs make the complex data into a simple form, which can be easily understood by anyone without having prior knowledge of the data. It gives ready to use information, and the user can use it accordingly. In this way, it saves a lot of time and labour.
6. Universally acceptable: Graphs and diagrams are used in every field and can be easily understood by anyone. Hence they are universally acceptable.
7. Helps in decision making: Diagrams and graphs give the real data about the past patterns, trends, outcomes, etc., which helps in future preparation.
Demerits of Diagrammatic and Graphics Presentation:
The demerits of diagrammatic and graphics presentation of data are as follows:
1. Handle with care: Drawing, surmising and understanding from graphs and diagrams needs proper insight and care. A person with little knowledge of statistics cannot analyze or use the data properly.
2. Specific information: Graphs and diagrams do not depict true or precise information. They are generally founded on approximations. The information provided is limited and specific.
3. Low precision: Graphs and diagrams can give misleading results, as they are mostly based on approximation of data. Personal judgement is used to study or analyze the data, which can make the information biased. Also, data can easily be manipulated.
Like Article
Suggest improvement
Share your thoughts in the comments
Please Login to comment...