For loop in R
Last Updated :
06 Jun, 2023
For loop in R Programming Language is useful to iterate over the elements of a list, data frame, vector, matrix, or any other object. It means the for loop can be used to execute a group of statements repeatedly depending upon the number of elements in the object. It is an entry-controlled loop, in this loop, the test condition is tested first, then the body of the loop is executed, the loop body would not be executed if the test condition is false.
For loop in R Syntax:
for (var in vector)
 {
   statement(s)
}
Here, var takes on each value of the vector during the loop. In each iteration, the statements are evaluated.
Flowchart of For loop in R:
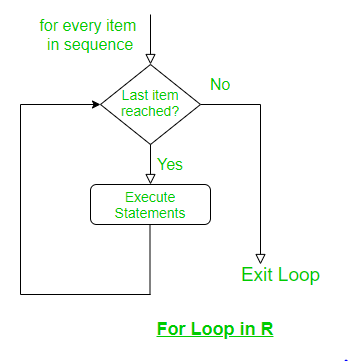
For loop in R
Iterating over a range in R – For loop
R
for (i in 1: 4)
{
print(i ^ 2)
}
|
Output:
[1] 1
[1] 4
[1] 9
[1] 16
In the above example, we iterated over the range 1 to 4 which was our vector. Now there can be several variations of this general for loop. Instead of using a sequence 1:5, we can use the concatenate function as well.
Using concatenate function in R – For loop
R
for (i in c(-8, 9, 11, 45))
{
print(i)
}
|
Output:
[1] -8
[1] 9
[1] 11
[1] 45
Instead of writing our vector inside the loop, we can also define it beforehand.
Using concatenate outside the loop R – For loop
R
x <- c(-8, 9, 11, 45)
for (i in x)
{
print(i)
}
|
Output:
[1] -8
[1] 9
[1] 11
[1] 45
Nested For-loop in R
R programming language allows using one loop inside another loop. In loop nesting, we can put any type of loop inside of any other type of loop. For example, a for loop can be inside a while loop or vice versa. The following section shows an example to illustrate the concept:
Example:
R
for (i in 1:3)
{
for (j in 1:i)
{
print(i * j)
}
}
|
Output:
[1] 1
[1] 2
[1] 4
[1] 3
[1] 6
[1] 9
Jump Statements in R
We use a jump statement in loops to terminate the loop at a particular iteration or to skip a particular iteration in the loop. The two most commonly used jump statements in loops are:
Break Statement:
A break statement is a jump statement that is used to terminate the loop at a particular iteration. The program then continues with the next statement outside the loop(if any).
Example:
R
for (i in c(3, 6, 23, 19, 0, 21))
{
if (i == 0)
{
break
}
print(i)
}
print("Outside Loop")
|
Output:
[1] 3
[1] 6
[1] 23
[1] 19
[1] Outside loop
Here the loop exits as soon as zero is encountered.
Next Statement
It discontinues a particular iteration and jumps to the next iteration. So when next is encountered, that iteration is discarded and the condition is checked again. If true, the next iteration is executed. Hence, the next statement is used to skip a particular iteration in the loop.
Example:
R
for (i in c(3, 6, 23, 19, 0, 21))
{
if (i == 0)
{
next
}
print(i)
}
print('Outside Loop')
|
Output:
[1] 3
[1] 6
[1] 23
[1] 19
[1] 21
[1] Outside loop
Creating Multiple Plots within for-Loop in R
R
mat <- matrix(rnorm(100), ncol = 5)
par(mfrow = c(2, 3))
for (i in 1:5) {
hist(mat[, i], main = paste("Column", i), xlab = "Values", col = "lightblue")
}
|
Output:
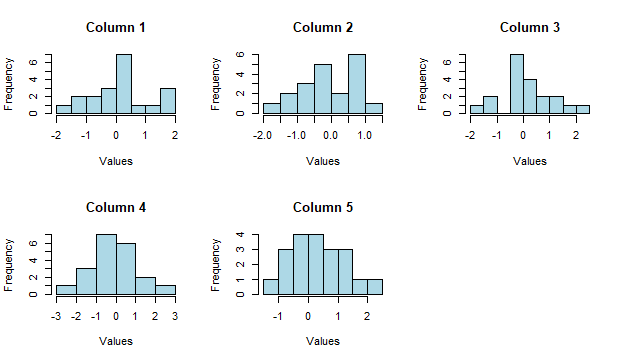
For loop in R
In this example, the for loop iterates over the columns of the matrix mat, and for each column, a histogram of the values is created using the hist() function. The main argument of the hist() function is used to set the title of each plot, and the xlab argument is used to label the x-axis. The col argument is used to set the color of the bars in the histogram to light blue.
The par() function is used to set up the plot layout with mfrow = c(2, 3), which specifies that the plots should be arranged in 2 rows and 3 columns. This means that the for loop will create 5 plots, each of which is a histogram of one of the columns of the matrix mat, arranged in a 2×3 grid.
Here as soon as zero is encountered, that iteration is discontinued and the condition is checked again. Since 21 is not equal to 0, it is printed. As we can conclude from the above two programs the basic difference between the two jump statements is that the break statement terminates the loop and the next statement skips a particular iteration of the loop.
Like Article
Suggest improvement
Share your thoughts in the comments
Please Login to comment...