Grid and Lattice Packages in R Programming
Last Updated :
25 Nov, 2021
Every programming language has packages to implement different functions. Many functions are bundled together in a package. To use those functions, installation and loading of these packages are required. In R programming, there are 10, 000 packages in the CRAN repository. Grid and Lattice are some of the packages in R Programming Language which implement graphical functions to develop some graphical outputs such as rectangle, circle, histogram, barplot, etc.
R – Grid Package
Grid package in R Programming Language has been removed from CRAN repository as it is now available as the base package. This package is a basis for all other higher graphical functions used in other packages such as lattice, ggplot2, etc. Also, it can manipulate the lattice outputs. Being a base package, there is no requirement to install it. It is automatically installed when R is installed.
To load the grid package, use the below command in console and select “grid” when menu appears:
local({pkg <- select.list(sort(.packages(all.available = TRUE)), graphics=TRUE) + if(nchar(pkg)) library(pkg, character.only=TRUE)})
grid package uses functions circleGrob, linesGrob, polygonGrob, rasterGrob, rectGrob, segmentsGrob, legendGrob, xaxisGrob, and yaxisGrob to create graphical objects (grobs).
To see the list of all the functions in grid package, use the below command:
library(help = "grid")
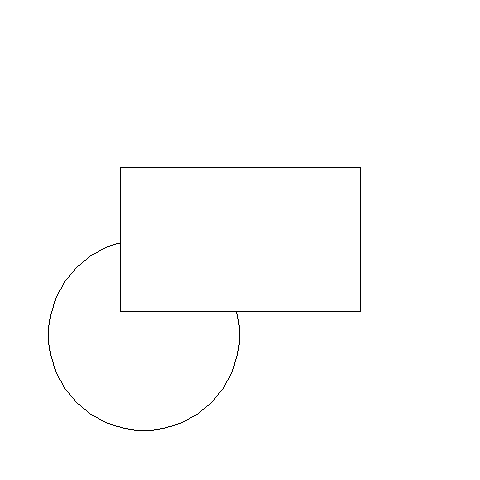
Below is an implementation of some functions on-grid package.
Example:
R
library(grid)
png(file ="grid-gfg.png")
cir <- circleGrob(name = "cir", x = 0.3, y = 0.3, r = 0.2,
gp = gpar(col = "black", lty = 3))
grid.draw(cir)
rect <- rectGrob(name = "rect", x = 0.5, y = 0.5,
width = 0.5, height = 0.3)
grid.draw(rect)
dev.off()
|
Output:
R – lattice Packages
The lattice package uses grid package to provide better relationships between the data. It is an add-on package for the implementation of Trellis graphics (graphics that shows relationships between variables conditioned together).
To install Lattice Packages in R
install.packages("lattice")
There are so many graphs present in the package such as barchart, counterplot, densityplot, histogram, etc. A simple format to use is:
graph_type(formula, data)
where,
- graph_type represents the type of graph to represent
- formula specifies the variables or conditioned variables
To know about all functions of package:
library(help = "lattice")
Below is an implementation of some of the graphical functions in lattice package.
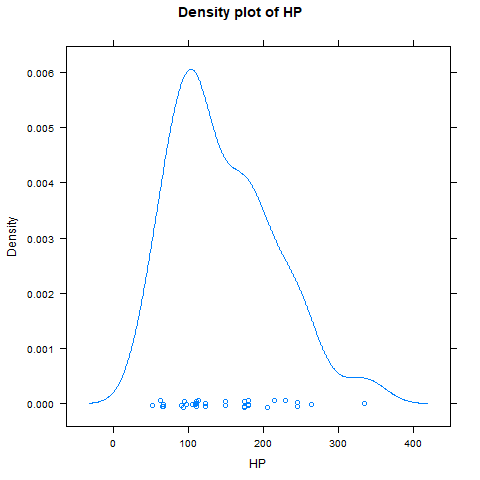
Example 1:
R
library(lattice)
attach(mtcars)
png("DensityPlotLatticeGFG.png")
densityplot(~hp, main ="Density plot of HP", xlab ="HP")
dev.off()
|
Output:
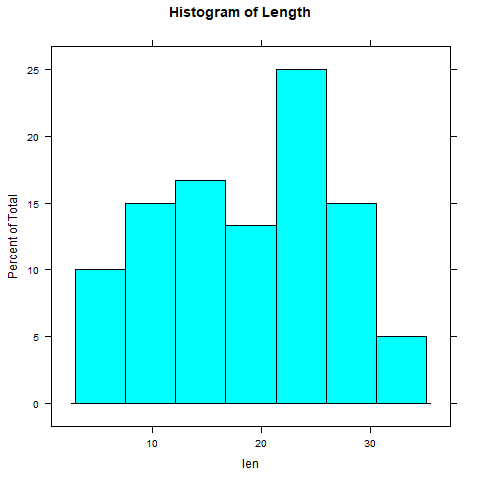
Example 2:
R
library(ToothGrowth)
png("HistogramLatticeGFG.png")
histogram(~len, data = ToothGrowth,
main = "Histogram of Length")
dev.off()
|
Output:
Like Article
Suggest improvement
Share your thoughts in the comments
Please Login to comment...