Grouping Categorical Variables in Pandas Dataframe
Last Updated :
04 Nov, 2022
Firstly, we have to understand what are Categorical variables in pandas. Categorical are the datatype available in pandas library of python. A categorical variable takes only a fixed category (usually fixed number) of values. Some examples of Categorical variables are gender, blood group, language etc. One main contrast with these variables are that no mathematical operations can be performed with these variables.
A dataframe can be created in pandas consisting of categorical values using Dataframe constructor and specifying dtype = ”category”.
Python3
import pandas as pd
df = pd.DataFrame({'A': ['a', 'b', 'c',
'c', 'a', 'b'],
'B': [0, 1, 1, 0, 1, 0]},
dtype = "category")
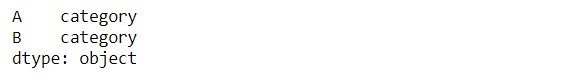
df.dtypes
|
Output:
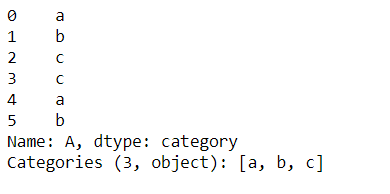
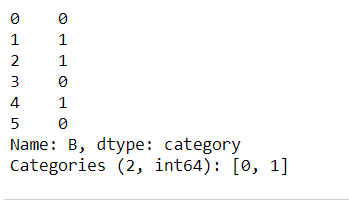
Here one important thing is that categories generated in each column are not same, conversion is done column by column as we can see here:
Output:
Now, in some works, we need to group our categorical data. This is done using the groupby() method given in pandas. It returns all the combinations of groupby columns. Along with group by we have to pass an aggregate function with it to ensure that on what basis we are going to group our variables. Some aggregate function are mean(), sum(), count() etc.
Now applying our groupby() along with count() function.
Python3
print(df)
print(df.groupby(['A']).count().reset_index())
|
Output:
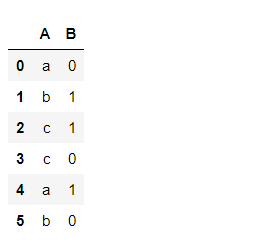
dataframe
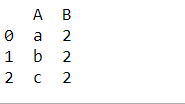
Group by column ‘A’
Now, one more example with mean() function. Here column A is converted to categorical and all other are numerical and mean is calculated according to categories of column A and column B.
Python3
import pandas as pd
df = pd.DataFrame({'A': ['a', 'b', 'c',
'c', 'a', 'b'],
'B': [0, 1, 1,
0, 1, 0],
'C':[7, 8, 9,
5, 3, 6]})
df['A'] = df['A'].astype('category')
print(df)
print(df.groupby(['A','B']).mean().reset_index())
|
Output:
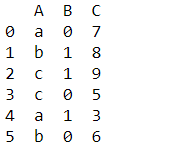
Dataframe
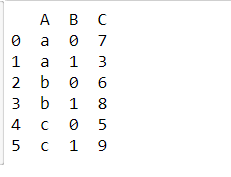
Group by both column ‘A’ and ‘B’
Other aggregate functions are also implemented in the same way using groupby().
Like Article
Suggest improvement
Share your thoughts in the comments
Please Login to comment...