How to add Axis labels using networkD3 in R
Last Updated :
28 Jun, 2022
networkD3 is an R package used for creating a D3 (Data-Driven Documents) Network Graph. netwrorkD3 is constructed using the htmlwidget package. As the name said network, this graph can be constructed in the shape of a node and edge data frame. then it will perform a physics simulation to decide the most advantageous diagram in three dimensions. It is used to create a D3 Javascript network, tree, dendrogram, Sankey graph, etc.
In the R package, there are already many visualization libraries present. For example ggplot, Plotly, igraph, etc. But not all libraries are used to create network-type graphs and it is also not in 3D plots. That is the main objective behind why it is made.
Syntax: sankeyNetwork( Links, Nodes, Source, Target, Value, NodeID, NodeGroup = NodeID, LinkGroup = NULL, units = “”, colourScale = NULL, fontSize = 7, fontFamily = NULL, nodeWidth = 15, nodePadding = 10, margin = NULL, height = NULL, width = NULL, iterations = 32, sinksRight = TRUE )
Parameters:
- Links: dataframe represent link between source and target (node).
- Nodes: dataframe contain node properties
- Source: character string of source node
- Target: character string of target node
- Value: character string of distance value between nodes
- NodeID: node name
- NodeGroup: character string of the nodeIDs in nodes
- LinkGroup: character string for link between groups
- Units: character string to specify physical unit(value)
- colourscale: specify color scale
- nodeWidth: width of node
- nodePadding: padding between node
- sinksRight: Boolean. If it is True, last node moves to right border of graph
Creating a simple sankeyNetwork graph with Title, Subtitle, and Labels
Step: 1 Import the necessary library in Rstudio.
R
library(dplyr)
library(networkD3)
library(htmlwidgets)
library(manipulateWidget)
library(htmltools)
|
Step: 2 Create network data in a source-target data frame format.
- Here, we are linking A->D, B->E, and C->F nodes and assigning 3 values on each link. final table will look like myDataframe table image.
- The node table is containing every node entry uniquely.
- IDsource and IDtarget is a string character form of the source and the target node.
- match function will match take two-column and create a matching table from 1. But we are subtracting by ‘-1’ so that it can start with 0th character like for A node it is 0, B node it is 1 and so on.
R
Source_Node <- c("A","B","C","A","B",
"C","A","B","C")
Target_category <- c("D","E","F","D",
"E","F","D","E","F")
Frequency <- c(1,2,3,4,5,6,7,8,9)
myDataframe <- data.frame(Source_Node,
Target_category,Frequency)
nodes <- data.frame(name=c(as.character(myDataframe$Source_Node),
as.character(myDataframe$Target_category))
%>% unique())
myDataframe$IDsource=match(myDataframe$Source_Node,
nodes$name)-1
myDataframe$IDtarget=match(myDataframe$Target_category,
nodes$name)-1
|
Output:
Step: 3 Create a simple Sankey network chart.
As per the above sankeyNetwork syntax, we are assigning some parameters to generate our output.
R
graph1 <- sankeyNetwork(Links = myDataframe,
Nodes = nodes,
Source = "IDsource",
Target = "IDtarget",
Value = "Frequency",
NodeID = "name",
sinksRight=FALSE)
graph1
|
Output:
SankeyNetwork Graph
Step: 4 Add Title and Subtitle in graph1.
- To assign a title, we can use the prependContent function from the htmlwidgets tool.
- Create two h1 and h2 tags with text description and style.
- prepend these tags in our above graph1 by putting all these tags together in the prependContent function.
R
graph2 <- htmlwidgets::prependContent(graph1,
htmltools::tags$h1(
"GeeksForGeeks Title",
style="text-align:center;
color:
htmltools::tags$h2(
"GeeksForGeeks Subtitle",
style="color:
text-align:center;"))
graph2
|
Output:

SankeyNetwork graph with title and subtitle
Step: 5 Add left and right labels in networkGraph.
- create left-tag as leftTx and right-tag as rightTx.
- Now, to combine leftTx, rightTx and graph2, use combineWidget from manipulatewidget library.
- combineWidget take, graph, title, left-column, right-column, and row-number as parameters and combine all these instances into one.
Syntax: combineWidgets( list = NULL, nrow = NULL, ncol = NULL, title = NULL, rowsize = 1, colsize = 1, byrow = TRUE, titleCSS = “”, header = NULL, footer = NULL, leftCol = NULL, rightCol = NULL, width = NULL, height = NULL )
R
leftTx = tags$div(
style="max-width: 30vw; height: 100%;
display: flex; align-items: center;
justify-content: center;",
tags$p("This is left side label"))
rightTx = tags$p("This is right side label",
style="max-width:30vw")
graph3 <- combineWidgets(graph2,
title = tags$h1("With left-right label",
style="text-align:center;color:#007500;"),
leftCol = leftTx,
rightCol = rightTx,
nrow = 1)
graph3
|
Output:
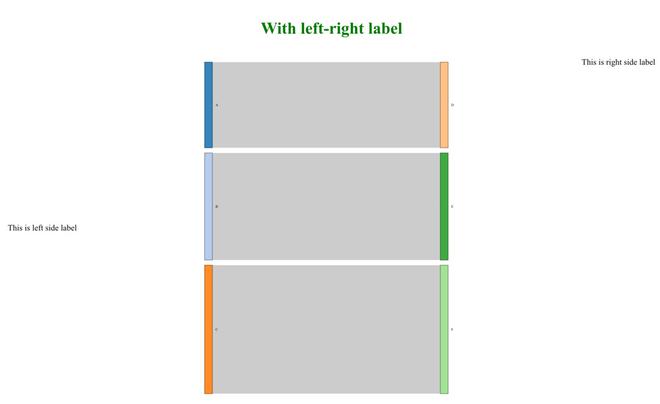
Output with left & right label
Like Article
Suggest improvement
Share your thoughts in the comments
Please Login to comment...