How to add center align text it in each subplot graph in seaborn?
Last Updated :
11 Jun, 2021
In this article, we are going to see how to add text in the center above each subplot using seaborn. Centering a title is a great way to represent the variability in your data. It can be applied to graphs to provide an additional layer of information on the presented data.
Functions Used:
FacetGrid: It is a general way of plotting a grid based on a function. It helps us in visualizing the distribution of variables as well as the relationship between multiple variables. FacetGrid object uses the data frame as Input and the names of the variables that shape the column, row, dimensions of the grid, the syntax is given below:
Syntax: seaborn.FacetGrid( data, \*\*kwargs)
- data: Tidy data frame where each column is a variable and each row is an observation.
- \*\*kwargs: It uses many arguments as input such as i.e. row, col, hue, palette, etc.
Map method: The map() method is vastly used to apply a function or operation on a sequence of data. It applies a function on all the items of an iterator given as input after applying a specific function to all the elements of iterable and return
Syntax: map(function, iterable)
Parameter:
- function Required: The function to execute for each item
- iterable Required: A collection of row-column, sequence, or an iterator object.
Text method: This function is used to add text to the axes at location x, y in data coordinates.
Syntax: text(x, y, text, fontsize = int )
- x, y: The position to place the text.
- text: “your text”.
- fontsize: size of text in integer form.
Below is the implementation of the above method:
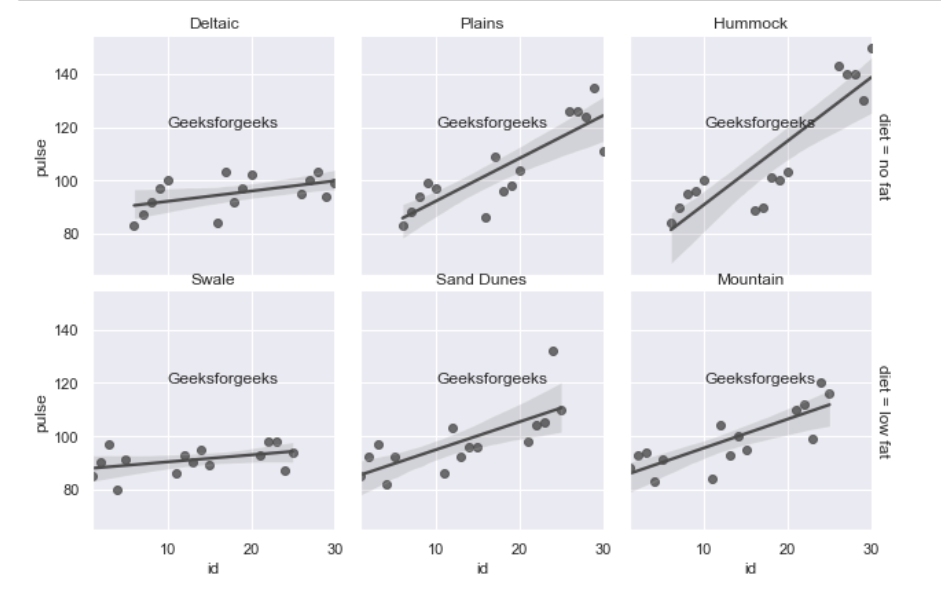
Example 1: Here we are plotting a regplot graph by calling sns.regplot, This method is used to plot data and a linear regression model.
Here we have a graph in which we have added an annotation to the inner part of the graph at a certain area where we’re adding our text at positions x=10 and y=120 with fontsize=12. Please find my code below:
Python3
import seaborn as sns
sns.set_style("darkgrid")
exercise = sns.load_dataset("exercise")
g = sns.FacetGrid(exercise, row="diet",
col="time", margin_titles = True)
g.map(sns.regplot, "id", "pulse", color = ".3")
col_order=['Deltaic', 'Plains','Hummock',
'Swale', 'Sand Dunes', 'Mountain']
for txt, title in zip(g.axes.flat, col_order):
txt.set_title(title)
txt.text(10, 120,'Geeksforgeeks', fontsize = 12)
|
Output:
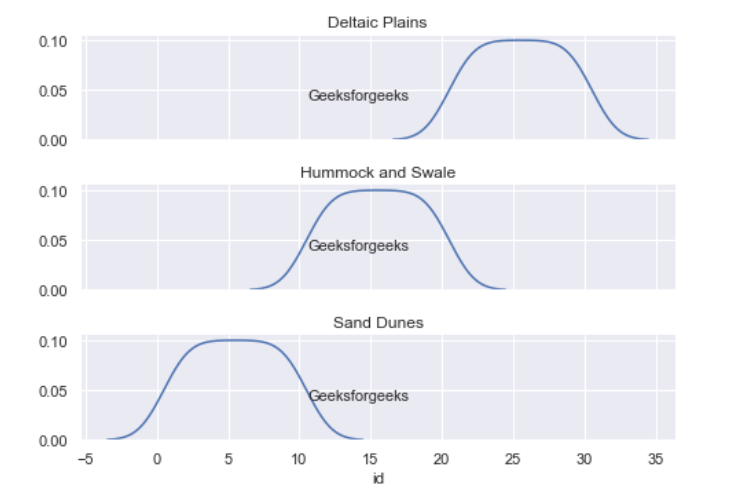
Example 2: In this example, we are plotting kdeplot by calling sns.kdeplot, which represents the probability distribution of the data values as the area under the plotted curve. Here we have a graph in which we have added an annotation to the inner part of the graph at a certain area, here we’re adding our text at positions x=10.58 and y=0.04 with fontsize=11. Please find my code below:
Python3
import seaborn as sns
import pandas as pd
sns.set_style("darkgrid")
exercise = sns.load_dataset("exercise")
exercise_kind = exercise.kind.value_counts().index
g = sns.FacetGrid(exercise, row="kind",
row_order=exercise_kind,
height=1.7, aspect=4,)
g.map(sns.kdeplot, "id")
col_order=['Deltaic Plains','Hummock and Swale',
'Sand Dunes']
for txt, title in zip(g.axes.flat, col_order):
txt.set_title(title)
txt.text(10.58, 0.04,'Geeksforgeeks', fontsize = 11)
|
Output:
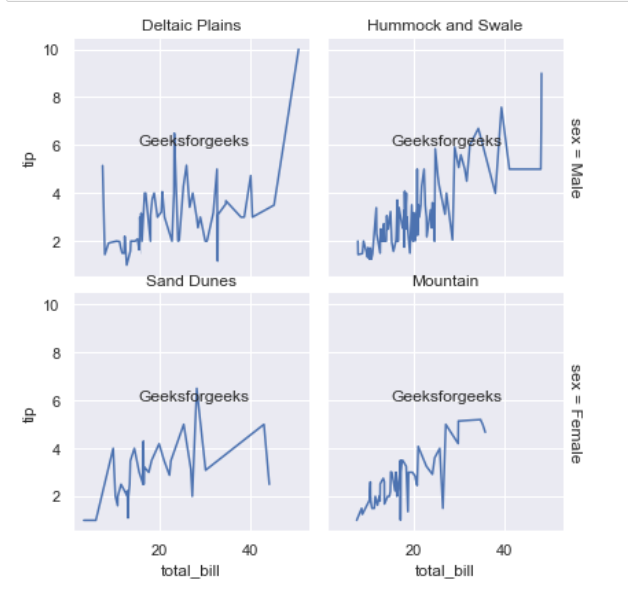
Example 3: In this example, we are plotting line plot, sns.lineplot is charts that are normally used to identify trends over a period of time. Here we have a graph in which we have added an annotation to the inner part of the graph at a certain area here we’re adding our text at positions x=15 and y=6 with fontsize=12. Please find my code below:
Python3
import seaborn as sns
import pandas as pd
sns.set_style("darkgrid")
tips = sns.load_dataset("tips")
g = sns.FacetGrid(tips, row = "sex",
col = "smoker",
margin_titles = True)
g.map(sns.lineplot, "total_bill", 'tip')
col_order = ['Deltaic Plains','Hummock and Swale',
'Sand Dunes', 'Mountain']
for txt, title in zip(g.axes.flat, col_order):
txt.set_title(title)
txt.text(15, 6,'Geeksforgeeks', fontsize = 12)
|
Output:
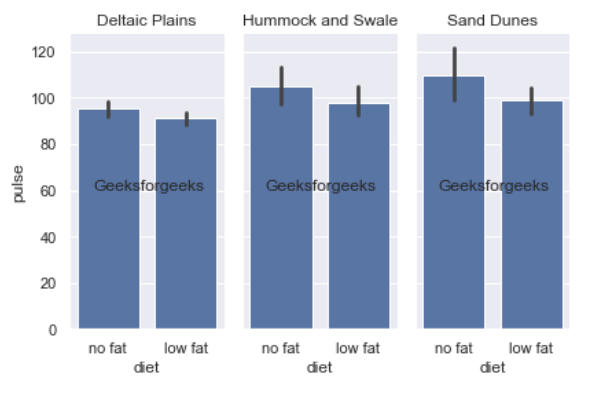
Example 4: In this example, we will plot Barplot by calling sns.barplot. It is a visualization of x and y numeric and categorical dataset variables in a graph to find the relationship between them. Here we add our text at positions x= -0.2 and y=60 with fontsize=12. Please find my code below:
Python3
import seaborn as sns
import pandas as pd
sns.set_style("darkgrid")
exercise = sns.load_dataset("exercise")
g = sns.FacetGrid(exercise, col="time",
height=4, aspect=.5)
g.map(sns.barplot, "diet", "pulse",
order=["no fat", "low fat"])
col_order=['Deltaic Plains','Hummock and Swale',
'Sand Dunes']
for txt, title in zip(g.axes.flat, col_order):
txt.set_title(title)
txt.text(-0.2, 60,'Geeksforgeeks', fontsize = 12)
|
Output:
Like Article
Suggest improvement
Share your thoughts in the comments
Please Login to comment...