How to Add Group-Level Summary Statistic as a New Column in Pandas?
Last Updated :
05 Sep, 2020
In this article, we will learn how to Add Group-Level Summary Statistic as a New Column in DataFrame Pandas. This can be done by using the concept of Statistic mean, mode, etc. This requires the following steps :
- Select a dataframe
- Form a statistical data from a column or a group of columns
- Store data as a series
- Add the series in dataframe as a column.
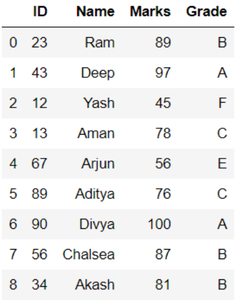
Here, we take a dataframe, The Dataframe consists of student id, name, marks and grades. Let’s create the dataframe
Python3
import pandas as pd
dct = {'ID': {0: 23, 1: 43, 2: 12,
3: 13, 4: 67, 5: 89,
6: 90, 7: 56, 8: 34},
'Name': {0: 'Ram', 1: 'Deep',
2: 'Yash', 3: 'Aman',
4: 'Arjun', 5: 'Aditya',
6: 'Divya', 7: 'Chalsea',
8: 'Akash'},
'Marks': {0: 89, 1: 97, 2: 45, 3: 78,
4: 56, 5: 76, 6: 100, 7: 87,
8: 81},
'Grade': {0: 'B', 1: 'A', 2: 'F', 3: 'C',
4: 'E', 5: 'C', 6: 'A', 7: 'B',
8: 'B'}
}
df = pd.DataFrame(dct)
df
|
Output:
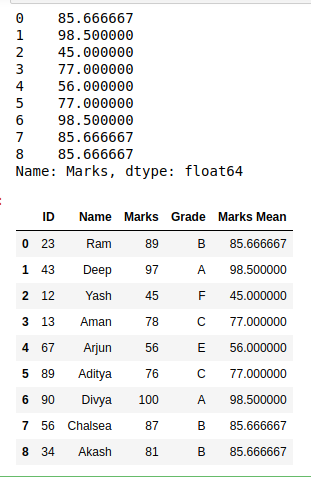
Now, we will find the group level statistics summary using the above approach.
Python3
new_column = df.groupby('Grade').Marks.transform('mean')
print(new_column)
df["Marks Mean"] = df.groupby('Grade').Marks.transform('mean')
print(df)
|
Output:
Like Article
Suggest improvement
Share your thoughts in the comments
Please Login to comment...