How to Avoid Overlapping Labels in ggplot2 in R?
Last Updated :
18 Oct, 2021
In this article, we are going to see how to avoid overlapping labels in ggplot2 in R Programming Language.
To avoid overlapping labels in ggplot2, we use guide_axis() within scale_x_discrete().
Syntax: plot+scale_x_discrete(guide = guide_axis(<type>))
In the place of we can use the following properties:
- n.dodge: It makes overlapping labels shift a step-down.
- check.overlap: This removes the overlapping labels and displays only those which do not overlap
Creating the basic barplot with overlapping labels
R
set.seed(5642)
sample_data <- data.frame(name = c("Geeksforgeeks1",
"Geeksforgeeks2",
"Geeksforgeeks3",
"Geeksforgeeks4",
"Geeeksforgeeks5") ,
value = c(31,12,15,28,45))
library("ggplot2")
plot<-ggplot(sample_data, aes(name,value, fill=name)) +
geom_bar(stat = "identity")
plot
|
Output:

Avoid overlapping labels
To avoid overlapping by shifting labels downward we use n.dodge parameter of guide_axis() function:
R
set.seed(5642)
sample_data <- data.frame(name = c("Geeksforgeeks1",
"Geeksforgeeks2",
"Geeksforgeeks3",
"Geeksforgeeks4",
"Geeeksforgeeks5") ,
value = c(31,12,15,28,45))
library("ggplot2")
plot<-ggplot(sample_data, aes(name,value, fill=name)) +
geom_bar(stat = "identity") +
scale_x_discrete(guide = guide_axis(n.dodge=2))
plot
|
Output:
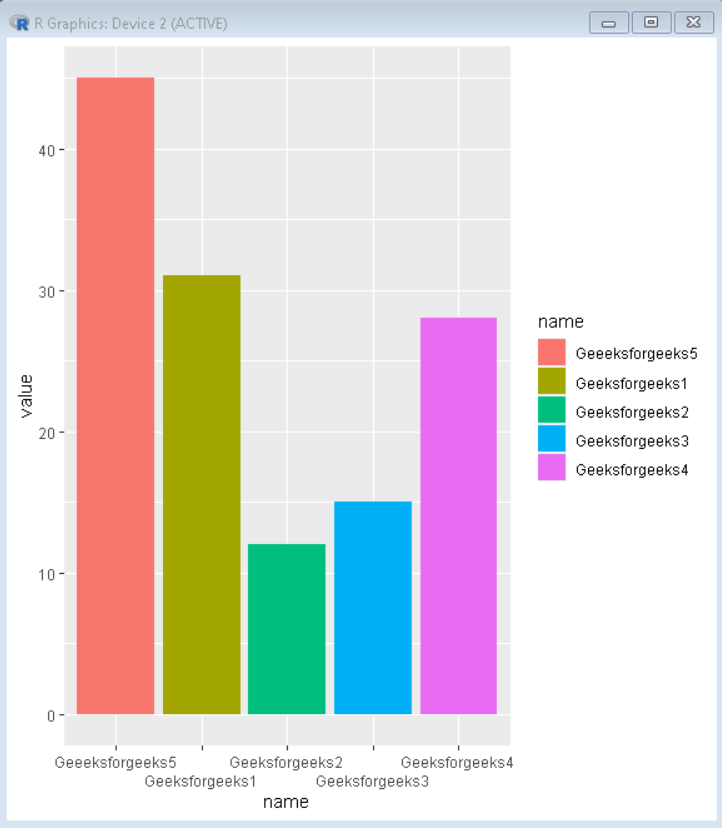
Remove overlapping
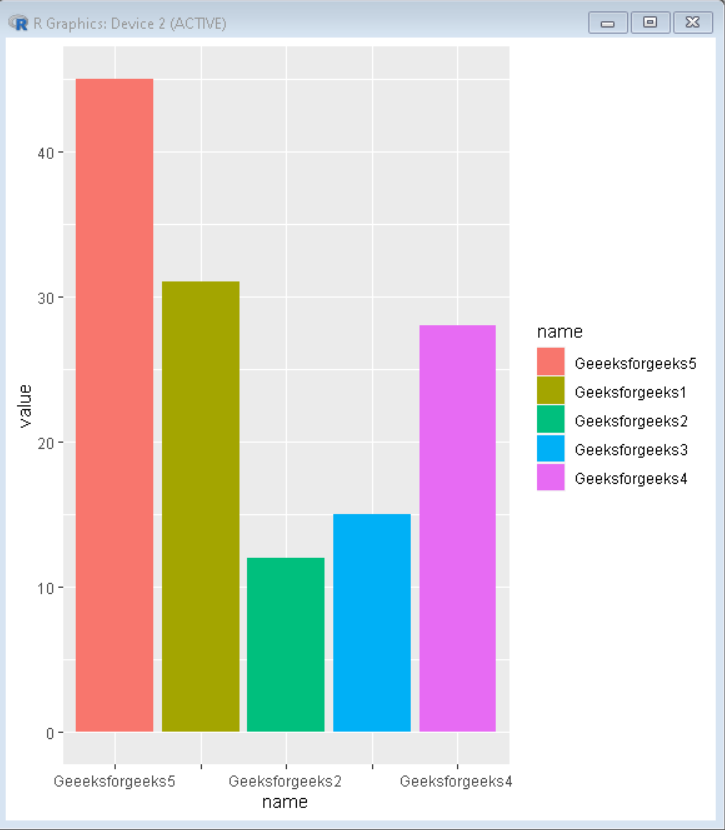
To remove overlapping labels we use check.overlap parameter of guide_axis() function:
R
set.seed(5642)
sample_data <- data.frame(name = c("Geeksforgeeks1",
"Geeksforgeeks2",
"Geeksforgeeks3",
"Geeksforgeeks4",
"Geeeksforgeeks5") ,
value = c(31,12,15,28,45))
library("ggplot2")
plot<-ggplot(sample_data, aes(name,value, fill=name)) +
geom_bar(stat = "identity") +
scale_x_discrete(guide = guide_axis(check.overlap = TRUE))
plot
|
Output:
Like Article
Suggest improvement
Share your thoughts in the comments
Please Login to comment...