How to change the position of legend using Plotly Python?
Last Updated :
28 Nov, 2021
In this article, we will discuss how to change the position of the legend in Plotly using Python.
The legend appears by default when variation in one object has to be depicted with reference to the other. Legend makes it easier to read a graph since it contains descriptions for the color code or keys used. By default, the legend appears on the top right corner of the plot but outside of it, but it is possible to position them as per requirement. Let us first create a regular plot so that the difference can be apparent.
Dataset Used: Click here
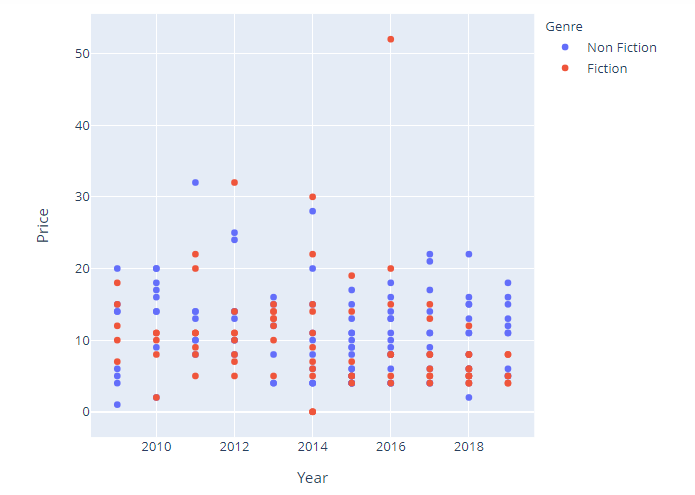
Example: Regular plot
Python3
import plotly.express as px
import pandas as pd
data = pd.read_csv("bestsellers.csv")
fig = px.scatter(data, x="Year", y="Price", color="Genre")
fig.show()
|
Output:
To position the legend we use the update_layout function with legend set to a dictionary that describes the attributes of a legend. anchor keys set position and x and y accommodate the margin with respect to axis.
Syntax:
update_layout(legend=dict(yanchor, y, xanchor, x))
By setting appropriate values to the above parameters the required task can be achieved.
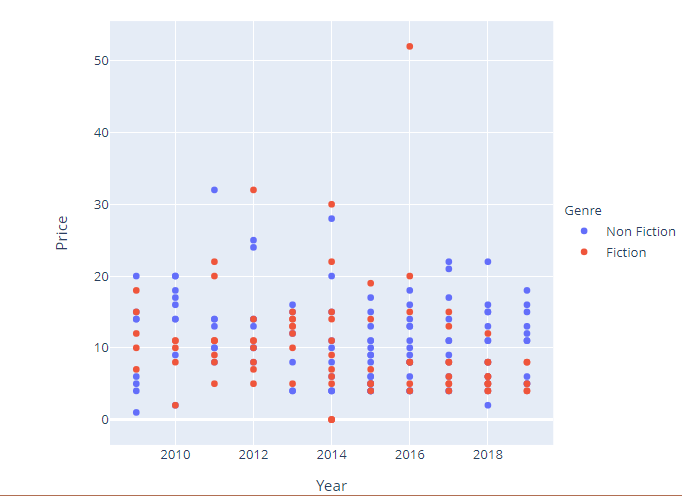
Example: Position the legend to the center
Python3
import plotly.express as px
import pandas as pd
data = pd.read_csv("bestsellers.csv")
fig = px.scatter(data, x="Year", y="Price", color="Genre")
fig.update_layout(legend=dict(y=0.5))
fig.show()
|
Output:
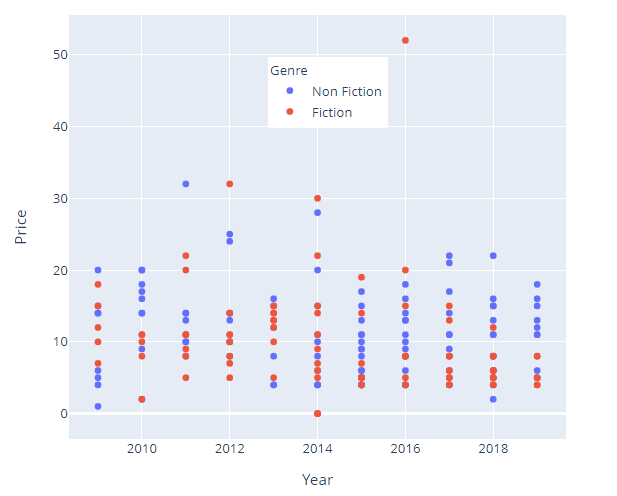
Example: Positioning legend on the plot
Python3
import plotly.express as px
import pandas as pd
data = pd.read_csv("bestsellers.csv")
fig = px.scatter(data, x="Year", y="Price", color="Genre")
fig.update_layout(legend=dict(yanchor="top", y=0.9, xanchor="left", x=0.4))
fig.show()
|
Output:
Like Article
Suggest improvement
Share your thoughts in the comments
Please Login to comment...