How to create a frequency table for categorical data in R ?
Last Updated :
30 Jun, 2021
In this article, we will see how to create a frequency table for categorical data in R Programming Language.
Method 1 : Using table() method
Tables in R are used for better organizing and summarizing the categorical variables. The table() method takes the cross-classifying factors belonging in a vector to build a contingency table of the counts at each combination of factor levels. A contingency table is basically a tabulation of the counts and/or percentages for multiple variables. It excludes the counting of any missing values from the factor variable supplied to the method. The output returned is in the form of a table. This method can be used for cross-tabulation and statistical analysis.
table (fac-vec, .. )
It can be converted to a data frame using as.data.frame() method which returns the output in the form of a tabular structure organized into two columns, the first one containing the input factor variable and second, the counts of the corresponding variables, designated by “Freq”.
as.data.frame(table)
In case, a single argument is specified the number of rows in the resultant data frame is equivalent to the number of unique levels of the factor. The rep() method is also used to repeat the first argument n number of times.
Code:
R
vec <- factor(c(letters[1 : 12],
letters[8 : 24],
letters[4 : 6]))
fac_vec <- rep(vec , 2)
freq <- table(fac_vec)
print ("Frequency DataFrame")
freq_df <- as.data.frame(freq)
print (freq_df)
|
Output:
[1] "Frequency DataFrame"
   fac_vec Freq
1        a    2
2        b    2
3        c    2
4        d    4
5        e    4
6        f    4
7        g    2
8        h    4
9        i    4
10       j    4
11       k    4
12       l    4
13       m    2
14       n    2
15       o    2
16       p    2
17       q    2
18       r    2
19       s    2
20       t    2
21       u    2
22       v    2
23       w    2
24       x    2
The table() method can take multiple arguments as input, and as a result, a data frame of all the possible unique combinations is returned. Each value of the first argument is mapped with the second argument value, and the frequency of this combination is returned.
R
set.seed(1)
data_frame = data.frame(
"col1" = sample(1:2, 8, replace = TRUE) ,
"col2" = sample(letters[1:3], 8, replace = TRUE)
)
print ("Data Frame")
print (data_frame)
freq <- table(data_frame$col1, data_frame$col2)
print ("Frequency DataFrame")
freq_df <- as.data.frame(freq)
print (freq_df)
|
Output:
[1] "Data Frame"
  col1 col2
1    1    b
2    2    b
3    1    c
4    1    c
5    2    a
6    1    a
7    1    a
8    1    b
[1] "Frequency DataFrame"
  Var1 Var2 Freq
1    1    a    2
2    2    a    1
3    1    b    2
4    2    b    1
5    1    c    2
6    2    c    0
The following program illustrates the concept of computing the frequency distribution over a large dataset and visualizing it:
R
library(data.table)
library("ggplot2")
file <- fread('ch11b.dat')
print ("Dataset 5 rows")
head(file)
data <- as.data.frame(file)
freq <- table(data$V5)
print ("Frequency count of column V5")
print (freq)
compute <- function(x) {
freq <- table(x)
factor(x, levels = names(sort(freq)))
}
ggplot(data, aes(x = compute(`V5`))) +
geom_bar() +
xlab("Gender")
|
Output:
[1] "Dataset 5 rows"
V1  V2   V3    V4 V5
1:  1 307  930 36.58  0
2:  2 307  940 36.73  0
3:  3 307  950 36.93  0
4:  4 307 1000 37.15  0
5:  5 307 1010 37.23  0
6:  6 307 1020 37.24  0
[1] "Frequency count of column V5"
0  1
38 62
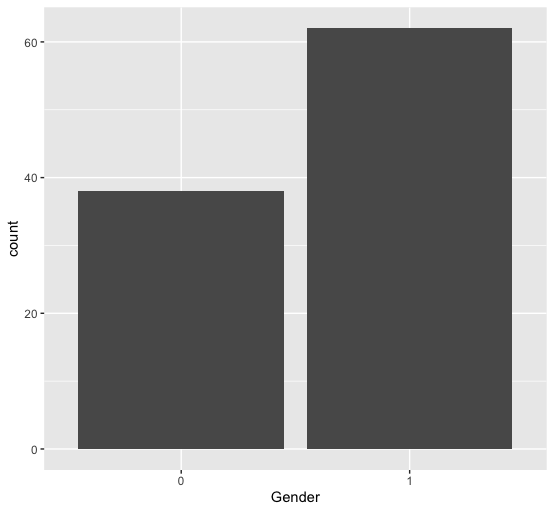
Frequency distribution over column V5
Method 2: Using count() method
The “plyr” package is used for data manipulation and modification, which can be installed into the working space using :
install.packages("plyr")
count() method in the plyr package is used to keep a frequency count of the categorical variables encountered. The method call is equivalent to as.data.frame(table(x)). However, it does not include combinations with zero counts. This method is considered to be better than table() method because it is faster and returns the output in the form of data frame, with direct headings for rows and columns.
count( fac-vec, .. )
Code:
R
library("plyr")
vec <- factor(c(letters[1:12],
letters[8:24],
letters[4:6]))
fac_vec <- rep(vec , 2)
freq <- count(fac_vec)
print ("Frequency DataFrame")
print (freq)
|
Output
[1] "Frequency DataFrame"
         x Freq
1        a    2
2        b    2
3        c    2
4        d    4
5        e    4
6        f    4
7        g    2
8        h    4
9        i    4
10       j    4
11       k    4
12       l    4
13       m    2
14       n    2
15       o    2
16       p    2
17       q    2
18       r    2
19       s    2
20       t    2
21       u    2
22       v    2
23       w    2
24       x    2
The following code snippet illustrates the usage of the table() method over very large datasets of the power of 105 elements divided into two categories Male and Female:
R
fac_vec <- factor(sample(c("Male", "Female"),
100000 , replace = TRUE))
freq <- count(fac_vec)
print ("Frequency DataFrame")
freq_df <- as.data.frame(freq)
print (freq_df)
|
Output:
[1] "Frequency DataFrame"
        x  freq
 1 Female 49936

2   Male 50064
Like Article
Suggest improvement
Share your thoughts in the comments
Please Login to comment...