How to Create a Scatterplot with a Regression Line in R?
Last Updated :
17 Feb, 2021
A scatter plot uses dots to represent values for two different numeric variables. Scatter plots are used to observe relationships between variables. A linear regression is a straight line representation of relationship between an independent and dependent variable. In this article, we will discuss how a scatter plot with linear regression can be drafted using R and its libraries.
A scatter plot can be used to display all possible results and a linear regression plotted over it can be used to generalize common characteristics or to derive maximum points that follow up a result. Here we will first discuss the method of plotting a scatter plot and then draw a linear regression over it.
Used dataset: Salary_Data.xls
In R, function used to draw a scatter plot of two variables is plot() function which will return the scatter plot.
Syntax: plot(x, y, main, xlab, ylab, xlim, ylim, axes)
Parameters:-
- x- is the data set whose values are the horizontal coordinates.
- y- is the data set whose values are the vertical coordinates.
- main- is the tile of the graph.
- xlab- is the label on the horizontal axis.
- ylab- is the label on the vertical axis.
- xlim- is the limits of the values of x used for plotting.
- ylim- is the limits of the values of y used for plotting.
- axes- indicates whether both axes should be drawn on the plot.
Return:-
A 2-Dimension scatter plot.
Program:
R
library(readxl)
Salary_Data <- read_excel("Salary_Data.xls")
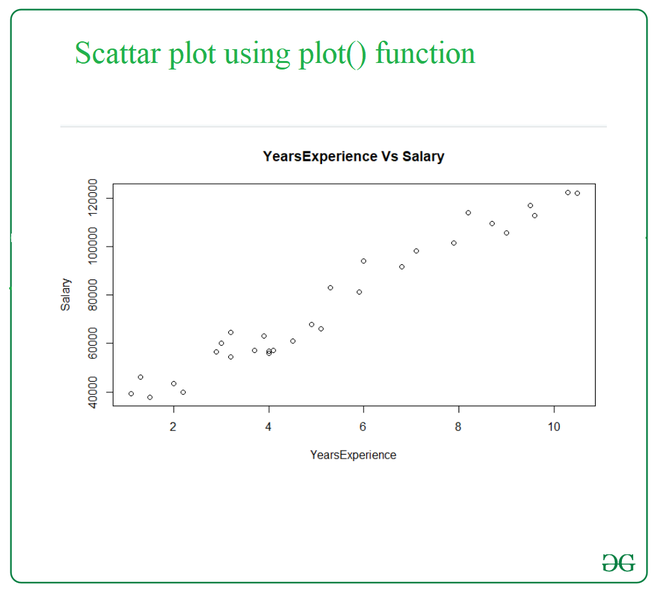
plot(Salary_Data$YearsExperience,Salary_Data$Salary,
main='YearsExperience Vs Salary',
xlab='YearsExperience', ylab='Salary')
|
Output:
A regression line is a straight line that describes how a response variable y(Dependent variable) changes as an explanatory variable x(Independent)changes. This is used to predict the value of y for a given value of x.
For drawing regression line we need two functions:
- abline() function is used to add one or more straight lines through the current plot
Syntax: abline(a=NULL, b=NULL, h=NULL, v=NULL, …)
Parameters:
a, b: It specifies the intercept and the slope of the line
h: specifies y-value for horizontal line(s)
v: specifies x-value(s) for vertical line(s)
Returns: a straight line in the plot
- lm() function which stands for linear model,” function can be used to create a simple regression model.
Syntax: lm(formula,data)
Parameters:
- the formula- is a symbol presenting the relation between x and y.
- data- is the vector on which the formula will be applied.
Returns:
The relationship line of x and y.
Program:
R
library(readxl)
Salary_Data <- read_excel("Salary_Data.xls")
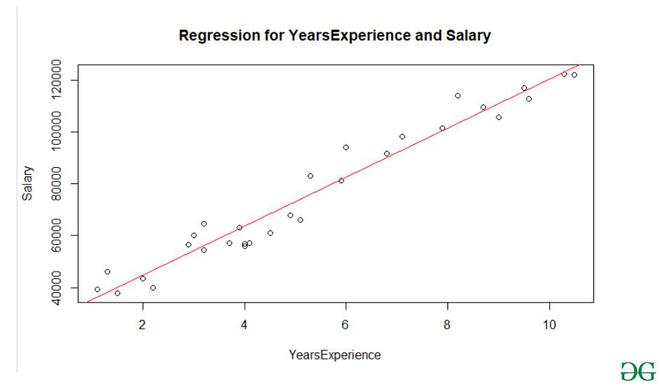
plot(Salary_Data$YearsExperience,Salary_Data$Salary,
main='Regression for YearsExperience and Salary',
xlab='YearsExperience',ylab='Salary')
abline(lm(Salary~YearsExperience,data=Salary_Data),col='red')
|
Output:
Like Article
Suggest improvement
Share your thoughts in the comments
Please Login to comment...