How to display only Values in Plot in R ?
Last Updated :
16 May, 2021
In this article, we will discuss how to display only Values in Plot in R Programming Language.
The two different approaches to display only values in the plot as follows:
- Displaying only values using text() function in Plot.
- Displaying only values using geom_text() function from ggplot2 Package in Plot.
Method 1: Displaying only values using text() function in Plot.
In this function user just need to call the text() function with the specified parameters into it after calling the plot() function in R language and this process will lead to a plot of the provided points by the user with the values in the plot.
text() function: This function is used to draws the strings given in the vector labels at the coordinates given by x and y in r language.
Syntax: text (x, y = NULL, labels = seq_along(x$x), adj = NULL,pos = NULL, offset = 0.5, vfont = NULL,cex = 1, col = NULL, font = NULL, …)
Parameters:
- x, y:-numeric vectors of coordinates where the text labels should be written. If the length of x and y differs, the shorter one is recycled.
- labels:-a character vector or expression specifying the text to be written
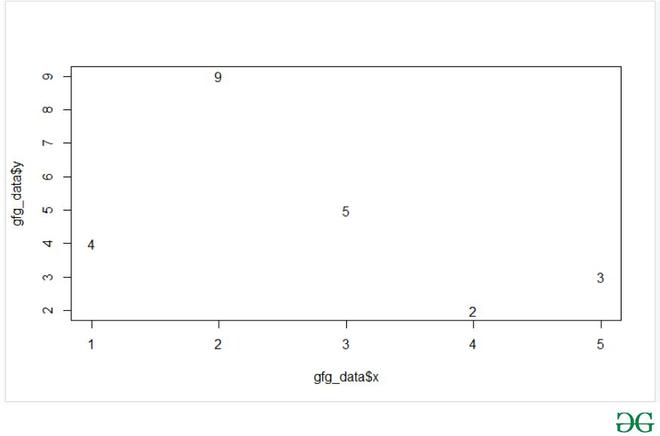
Example: In this example, we will be taking five points and displaying the value of y coordinate on the plot using the text() function in R language.
R
gfg_data <- data.frame(x =c(1,2,3,4,5),
y = c(4,9,5,2,3))
plot(x = gfg_data$x,y = gfg_data$y,type = "n")
text(x = gfg_data$x,y = gfg_data$y,labels = gfg_data$y)
|
Output:
Method 2: Displaying only values using geom_text() function from ggplot2 Package in Plot.
This method of displaying only values is the simplest method as compared with the previous one as in this method user just have to call geom_text() function with the ggplot() functions from the ggplot library of R language with the specified parameters and this function will be returning the plot displaying only values.
geom_text() function: This function is used for textual annotations in r language.
Syntax: geom_text(mapping = NULL, data = NULL, stat = “identity”,position = “identity”, parse = FALSE, …)
Parameters:
- parse:-If TRUE, the labels will be parsed into expressions and displayed as described in ?plotmath.
- mapping:-The aesthetic mapping, usually constructed with aes or aes_string.
- data:-A layer-specific dataset – only needed if you want to override the plot defaults.
- stat:-The statistical transformation to use on the data for this layer.
- position:-The position adjustment to use for overlapping points on this layer
- …:-other arguments passed on to layer. This can include aesthetics whose values you want to set, not map.
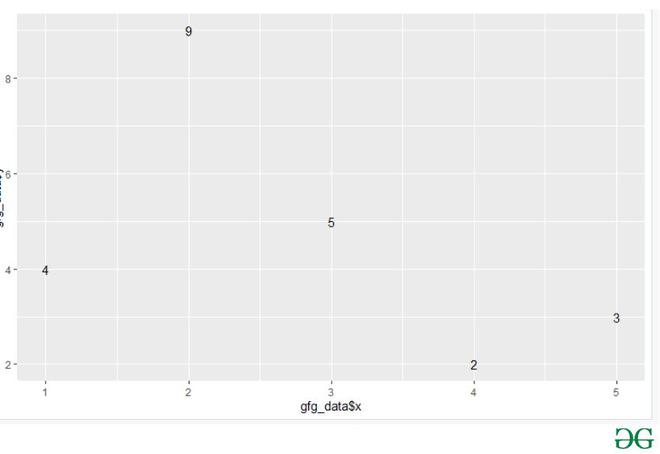
In this example, we will be taking five points (same as used previously) and displaying the value of y coordinate on the plot using the geom_text() function with the ggplot2 package in r language.
Below is the implementation:
R
library("ggplot2")
gfg_data <- data.frame(x =c(1,2,3,4,5),
y = c(4,9,5,2,3))
ggplot(gfg_data, aes(gfg_data$x, gfg_data$y,
label = gfg_data$y))+geom_text()
|
Output:
Like Article
Suggest improvement
Share your thoughts in the comments
Please Login to comment...