How to Extract the Intercept from a Linear Regression Model in R
Last Updated :
23 May, 2021
Linear regression is a method of predictive analysis in machine learning. It is basically used to check two things:
- If a set of predictor variables (independent) does a good job predicting the outcome variable (dependent).
- Which of the predictor variables are significant in terms of predicting the outcome variable and in what way, which is determined by the magnitude and sign of the estimates respectively.
Linear regression is used with one outcome variable and one or more than one predictor variable. Simple linear regression will work with one outcome and one predictor variable. The simple linear regression model is essentially a linear equation of the form y = c + b*x; where y is the dependent variable (outcome), x is the independent variable (predictor), b is the slope of the line; also known as regression coefficient and c is the intercept; labeled as constant.
A linear regression line is a line that best fits the graph between the predictor variable (independent) and the predicted variable (dependent).
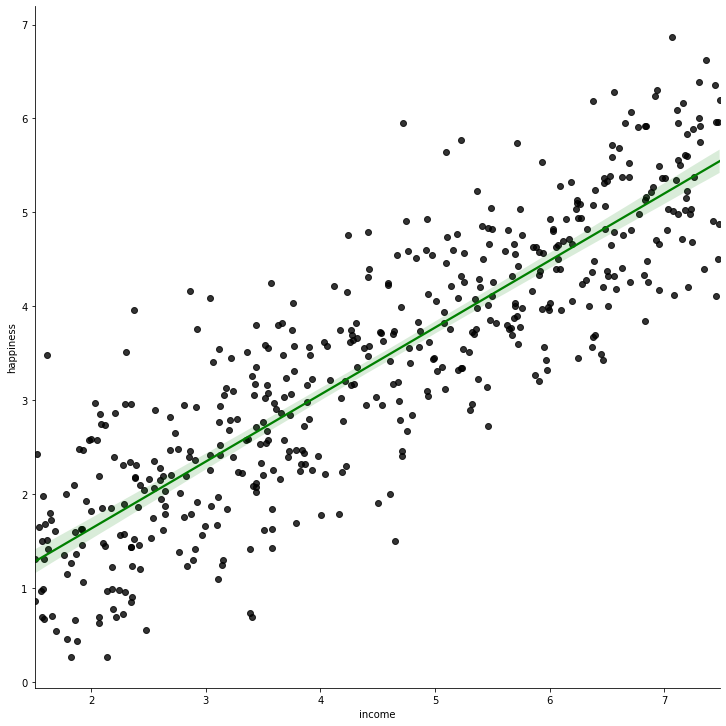
Regression line (solid green) for income vs happiness dataset
In the above diagram, the green line is the best fit line; and it is taken as the regression line for the given dataset.
One of the most popular methods of deciding the regression line is the method of least-squares. This method essentially works to find the best-fit line for the data by minimizing the sum of the squares of the vertical deviations from each data point (the deviation of a point residing on the line is 0). As the deviations are squared, there is no cancellation between the positive and negative values of the deviation.
Approach:
- Select a suitable problem statement for linear regression. We will be selecting income.data_.
- Install and load the packages for plotting/visualization. You can visualize the data points to see if the data is suitable for the linear regression.
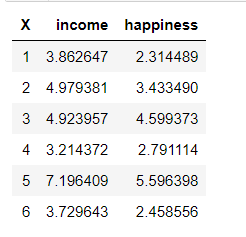
- Read the dataset in a data frame. You can also visualize the data frame after reading (example shown in the code below).
- Create a linear regression model from the data using lm() function. Store the created model in a variable.
- Explore the model.
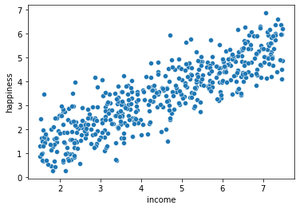
Scatter plot after plotting the dependent and independent variables against each other
Step 1: Install and load the required packages. Read and explore the dataset. You can also set the working directory of the notebook using setwd() function, passing the path of the directory (where the dataset is stored) as an argument.
R
install.packages("ggplot2")
install.packages("tidyverse")
library(ggplot2)
library(tidyverse)
dataFrame <- read.csv("income_data.csv")
head(dataFrame)
|
Output:
Step 2: Separate the variables of the dataset. Visualize the dataset.
R
x <- dataFrame$income
y <- dataFrame$happiness
plot(x, y)
|
Output:
Graph of X (Income) vs Y (Happiness)
Step 3: Clear the linear regression model from the data. Train and see the model.
Output:
Call:
lm(formula = y ~ x)

Coefficients:
(Intercept)            x
     0.2043       0.7138
As you can see, the value of intercept is 0.2043. But how to obtain this value in a variable?
Extracting the values of intercept
We can use a summary of the created model to extract the value of the intercept.
Code:
R
model_summary <- summary(model)
intercept_value <- model_summary$coefficients[1,1]
intercept_value
|
Output:
0.204270396204177
If you try to print the summary of the model (model_summary) variable, you will see the coefficients below. It is a 2D matrix, which stores all the said coefficients. Therefore, [1,1] will correspond to the predicted intercept (of the regression line).
R
model_summary <- summary(model)
model_summary
|
Output:
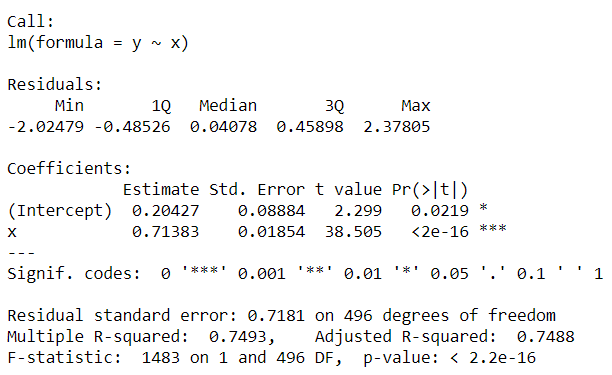
This is how we extract the value of intercept from a linear regression model in R.
Like Article
Suggest improvement
Share your thoughts in the comments
Please Login to comment...