How to Highlight a Bar in Barplot in R?
Last Updated :
18 Oct, 2021
In this article, we will discuss how to highlight a bar in barplot in R Programming language.
First, let’s create a basic barplot with no bars highlighted using ggplot2.
R
set.seed(5642)
sample_data <- data.frame(name = c("Geek1","Geek2",
"Geek3","Geek4",
"Geeek5") ,
value = c(31,12,15,28,45),
highlight= c(0,0,1,0,0) )
library("ggplot2")
plot<-ggplot(sample_data,
aes(name,value)) +
geom_bar(stat = "identity")
plot
|
Output:
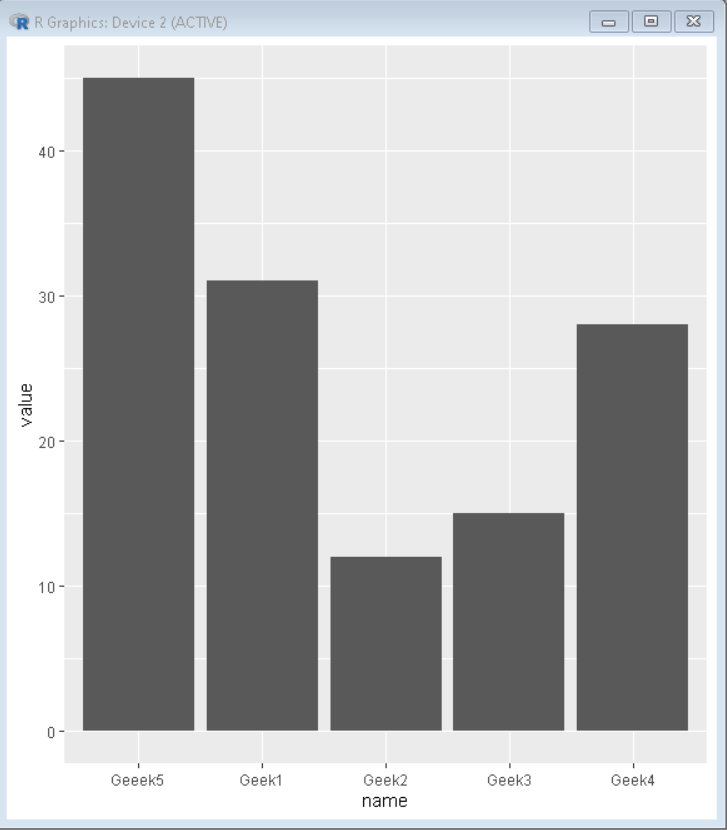
Highlighting bar in barplot
To create automated color in bars we use the fill property of the ggplot2 plot. We use a vector with the same value for all the bars except the one that needs to be highlighted.
R
set.seed(5642)
sample_data <- data.frame(name = c("Geek1","Geek2",
"Geek3","Geek4",
"Geeek5") ,
value = c(31,12,15,28,45),
highlight= c(0,0,1,0,0) )
library("ggplot2")
plot<-ggplot(sample_data,
aes(name, value, fill=highlight)) +
geom_bar(stat = "identity")
plot
|
Output:
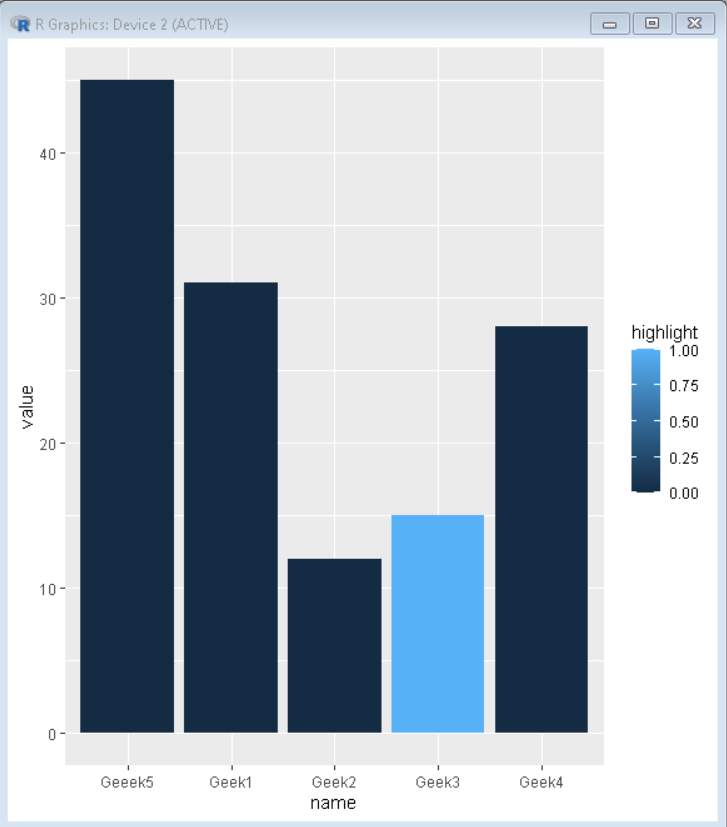
Highlighting specific bar in barplot
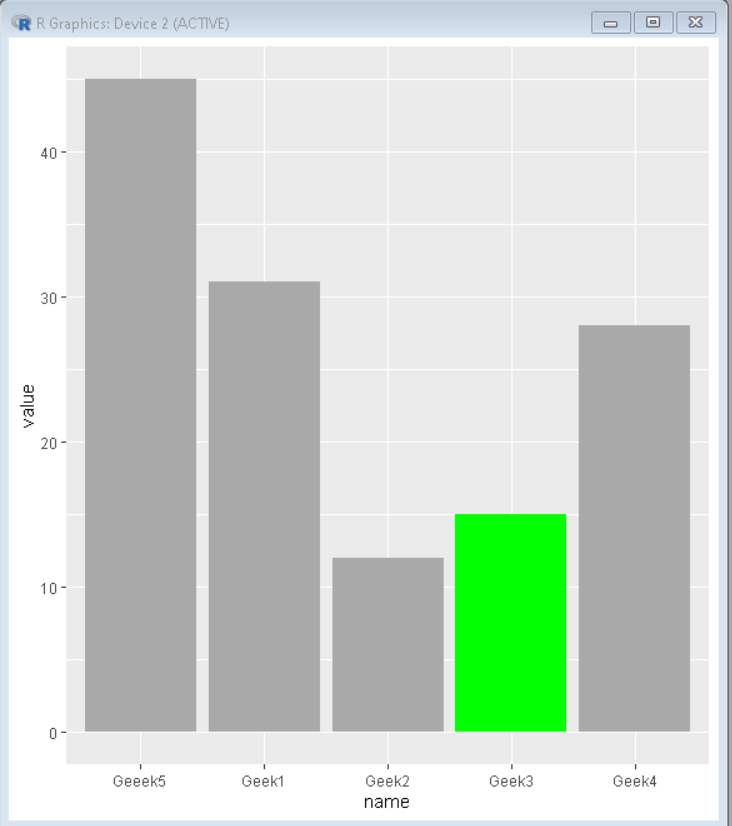
To create manual color in bars we use the fill property of the ggplot2 plot with scale_fill_manual() function. We use a vector with the same value for all the bars except the one that needs to be highlighted and then we define a color for each value so every bar is colored according to the value specified to it:
R
set.seed(5642)
sample_data <- data.frame(name = c("Geek1","Geek2",
"Geek3","Geek4",
"Geeek5") ,
value = c(31,12,15,28,45),
highlight= c("0","0","1","0","0") )
library("ggplot2")
plot<-ggplot(sample_data,
aes(name,value,fill=highlight)) +
geom_bar(stat = "identity")+
scale_fill_manual( values = c( "1"="green", "0"="darkgray" ),
guide = FALSE )
plot
|
Output:
Like Article
Suggest improvement
Share your thoughts in the comments
Please Login to comment...