How to make Log Plots in Plotly – Python?
Last Updated :
05 Sep, 2020
A Plotly is a Python library that is used to design graphs, especially interactive graphs. It can plot various graphs and charts like histogram, barplot, boxplot, spreadplot, and many more. It is mainly used in data analysis as well as financial analysis. plotly is an interactive visualization library.
What are the log plots?
A log plot is a way of displaying numerical data over a very wide range of values in a compact way. There are two types of plots:
- log-log plot: If both the vertical and horizontal axes of a plot are scaled logarithmically, the plot is referred to as a log-log plot.
- Semi-logarithmic plots: If only the ordinate or abscissa is scaled logarithmically, the plot is referred to as a semi-logarithmic plot.
Creating Log plots using plotly
There is no specific function provided for creating the log plots. However, it can be created using the scatter() method of graph_objects class. We will have to change the xaxis_type and yaxis_type to log.
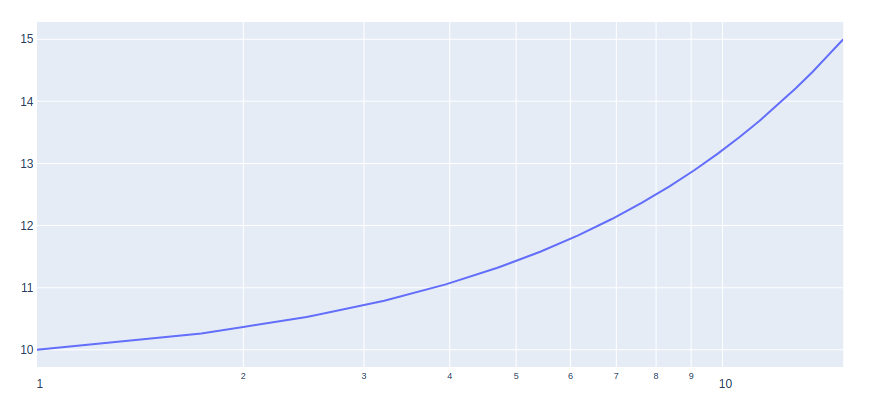
Example 1: log-log plot
Python3
import plotly.graph_objects as go
import numpy as np
x = np.linspace(1, 15, 20)
y = np.linspace(10, 15, 20)
fig = go.Figure()
fig.add_trace(go.Scatter(
x=x,
y=y
))
fig.update_layout(xaxis_type="log", yaxis_type="log")
fig.show()
|
Output:

Example 2: semi-log plot
Python3
import plotly.graph_objects as go
import numpy as np
x = np.linspace(1, 15, 20)
y = np.linspace(10, 15, 20)
fig = go.Figure()
fig.add_trace(go.Scatter(
x=x,
y=y
))
fig.update_layout(xaxis_type="log")
fig.show()
|
Output:
Like Article
Suggest improvement
Share your thoughts in the comments
Please Login to comment...