How to set axis limits in ggplot2 in R?
Last Updated :
23 Aug, 2021
In this article, we are going to see how to set the axis limit in ggplot2 in R Programming Language.
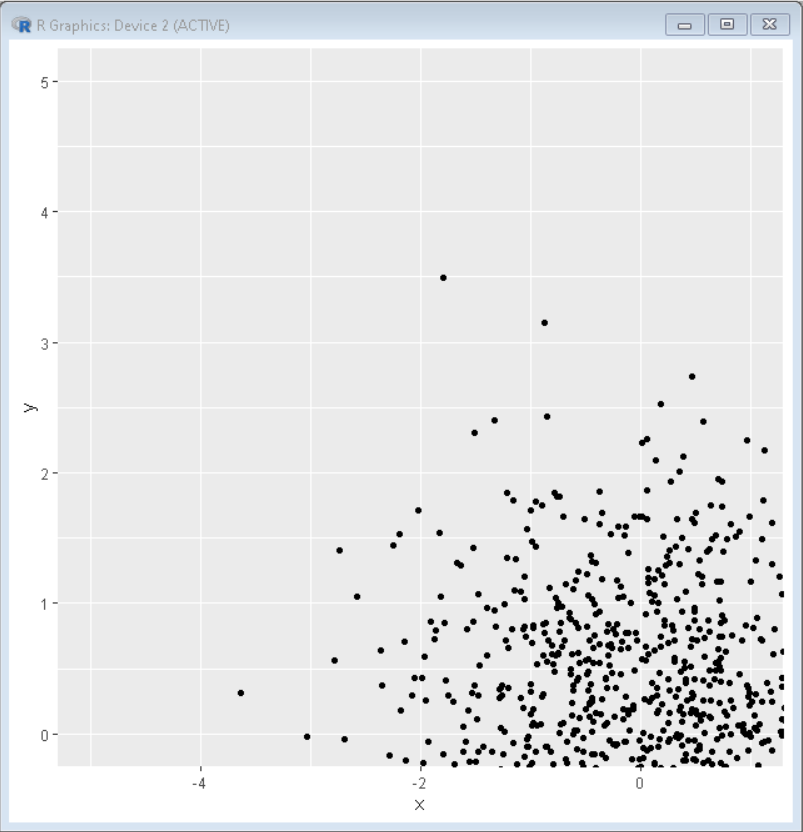
Method 1: Using coord_cartesian()
This method is most helpful as it displays the plot within the limits of the axis without clipping the actual data. It just zooms in and shows the area under limits. The coord_cartesian() function will be used to reject all outliers that exceed or below a given quartile
Syntax: plot + coord_cartesian(xlim = <lim-vec>, ylim = <lim-vec>)
Example: Set Axis Limits in ggplot2 in R
R
set.seed(5642)
sample_data <- data.frame(x = rnorm(1000),
y = rnorm(1000))
library("ggplot2")
ggplot(sample_data, aes(x = x, y = y)) +
geom_point() +
coord_cartesian(xlim = c(-5, 1), ylim = c(0, 5))
|
Output:
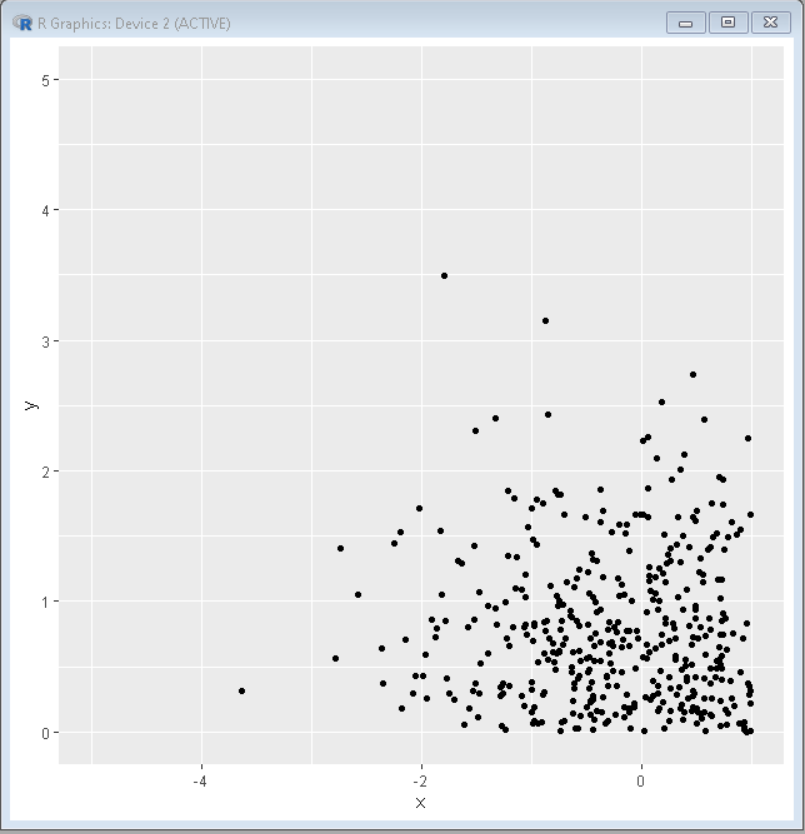
Method 2: Using xlim() and ylim()
This method clips the unused data, which means observations out of the set limit will not be sent to any layer and clipped off.
Syntax: plot+ xlim( xmin, xmax ) + ylim( ymin, ymax )
Example: Set Axis Limits in ggplot2 in R.
R
set.seed(5642)
sample_data <- data.frame(x = rnorm(1000),
y = rnorm(1000))
library("ggplot2")
ggplot(sample_data, aes(x = x, y = y)) +
geom_point() + xlim(-5, 1)+ ylim(0, 5)
|
Output:
Like Article
Suggest improvement
Share your thoughts in the comments
Please Login to comment...