How to Use Par Function in R?
Last Updated :
20 Dec, 2021
In this article, we will discuss how to use the par() function in the R Programming Language.
The par() function is used to set or query graphical parameters. We can divide the frame into the desired grid, add a margin to the plot or change the background color of the frame by using the par() function. We can use the par() function in R to create multiple plots at once. This helps us to create a figure arrangement with fine control.
Method 1: Create Multiple plots in the same window using par() function
To create multiple plots in the same window in the R Language, we first divide the frame into the desired grid by using the mfrow argument of the par() function. Here, we can pass a vector containing a number of rows and columns for the grid as value to argument mfrow and this will divide our frame into a grid of that number of rows and columns.
Syntax:
par( mfrow )
where,
- mfrow: determines a vector with row and column values for the grid.
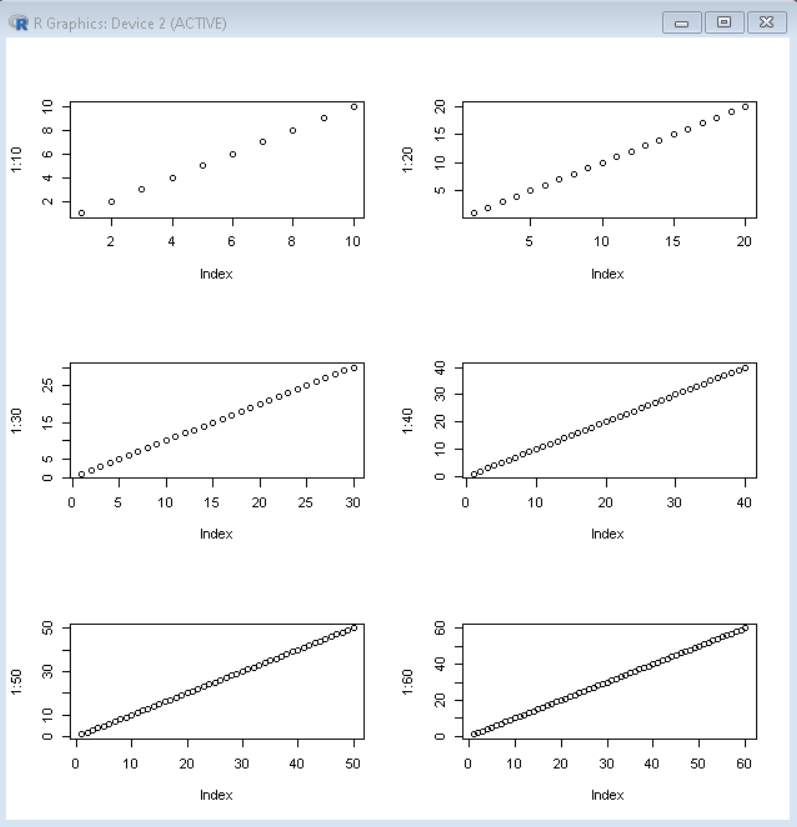
Example:
In this example, basic multiple plots in R Language made using the par() function. Here, we have divided the window into a 3X2 grid and plotted plots in it.
R
par( mfrow= c(3,2) )
plot( 1:10 )
plot( 1:20 )
plot( 1:30 )
plot( 1:40 )
plot( 1:50 )
plot( 1:60 )
|
Output:
Method 2: Increase or Decrease margin Around Plot using par() function
In this method to increase or decrease the margin around the plot in the R Language, the user need to use the mar argument of the par() function. Here, the mar argument takes a vector with all the margin values in the following order: bottom, left, top, right as value. The default is mar = c(5.1, 4.1, 4.1, 2.1).
Syntax:
par( mar )
where,
- mar: determines the margin vector in which margins are in the order: bottom, left, top, right
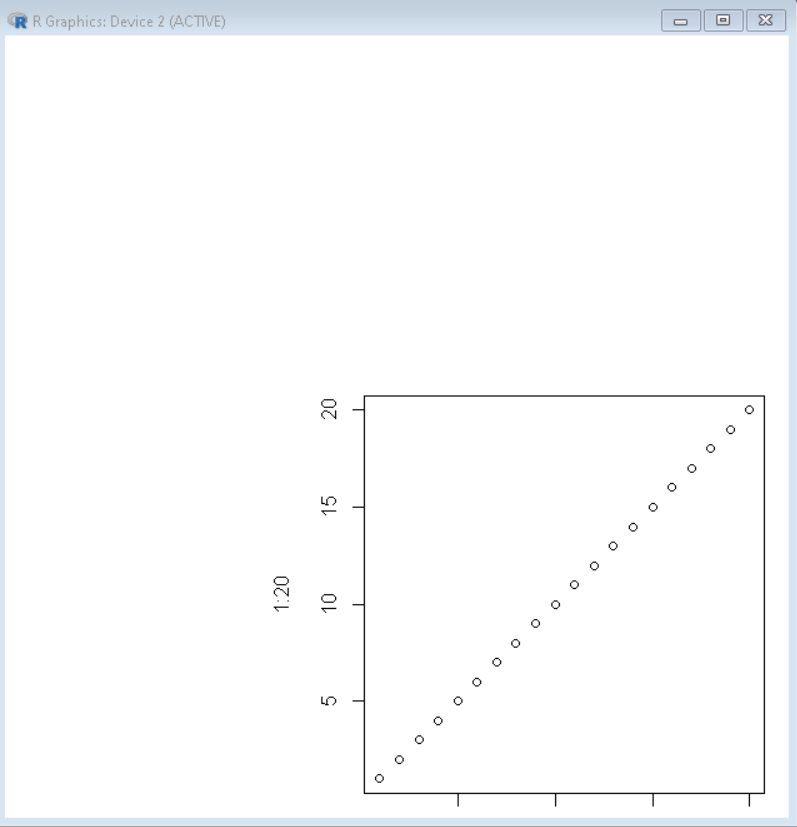
Example:
Under this example, we have added large left and top margins to a plot using the mar argument of par() function.
R
par( mar= c(1,15,15,1) )
plot( 1:20 )
|
Output:
Method 3: Change axis and tick label size using par() function
In this approach to change the axis and trick label size, the user needs to use the cex.lab() and cex.axis() arguments of the par() function to specify the size of the axis labels and the tick labels respectively in the R Language. The default value of both the cex.lab and cex.axis is 1.
Syntax:
par( cex.lab, cex.axis )
where,
- cex.lab: determines the size of the axis label.
- cex.axis: determines the size of the tick labels.
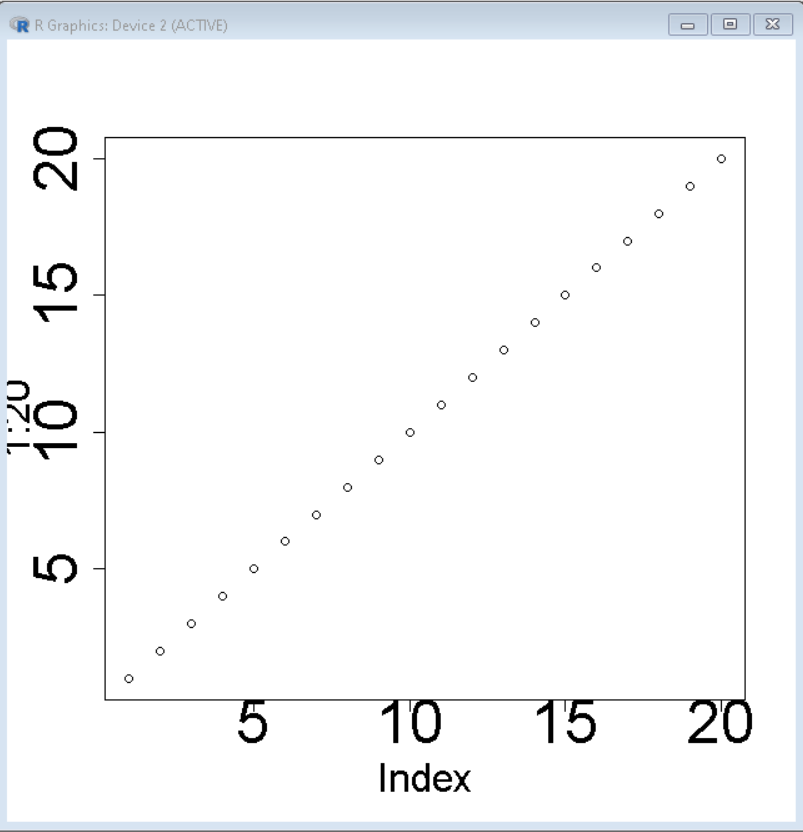
Example:
In this example, a plot with a large-sized axis and tick labels is made using the par() function with cex.axis and cex.lab parameter.
R
par( cex.axis= 3, cex.lab= 2)
plot(1:20)
|
Output:
Method 4: Change the background color of the window using par() function
To change the background color of the window in the R Language, we use the bg parameter of the par() function. The default color of the window is white. The bg parameter can take the value of color in any R Language acceptable format.
Syntax:
par( bg )
where,
- bg: determines the color of the background of the window.
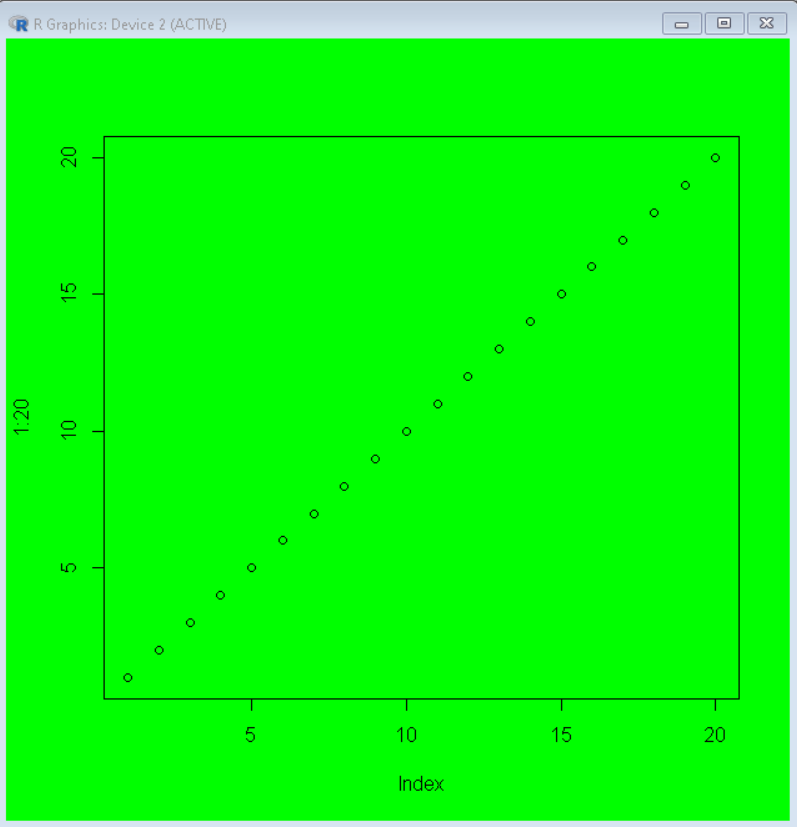
Example:
In this example, a green-colored background window for a basic plot made using the bg argument in the R Language.
R
par( bg = "green" )
plot( 1:20 )
|
Output:
Like Article
Suggest improvement
Share your thoughts in the comments
Please Login to comment...