Introduction to Resampling methods
Last Updated :
29 May, 2023
While reading about Machine Learning and Data Science we often come across a term called Imbalanced Class Distribution, which generally happens when observations in one of the classes are much higher or lower than in other classes.
As Machine Learning algorithms tend to increase accuracy by reducing the error, they do not consider the class distribution. This problem is prevalent in examples such as Fraud Detection, Anomaly Detection, Facial recognition, etc.
What is Resampling Method
Resampling Method is a statical method that is used to generate new data points in the dataset by randomly picking data points from the existing dataset. It helps in creating new synthetic datasets for training machine learning models and to estimate the properties of a dataset when the dataset is unknown, difficult to estimate, or when the sample size of the dataset is small.
Two common methods of Resampling are
- Cross Validation
- Bootstrapping
Cross Validation
Cross-Validation is used to estimate the test error associated with a model to evaluate its performance.
Validation set approach:
This is the most basic approach. It simply involves randomly dividing the dataset into two parts: first a training set and second a validation set or hold-out set. The model is fit on the training set and the fitted model is used to make predictions on the validation set.
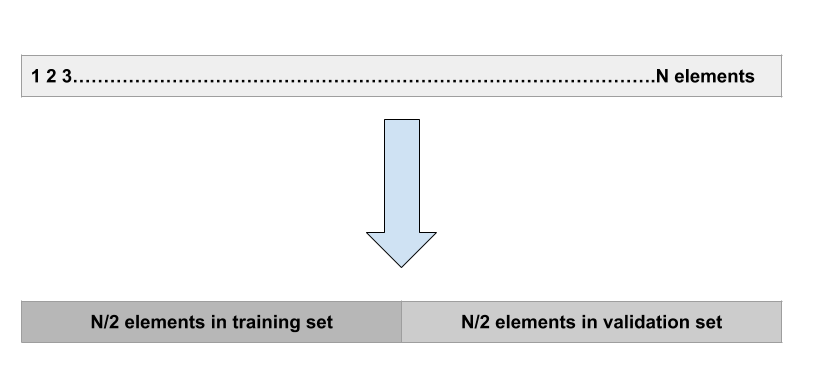
Validation Set Approach in Resampling Method
Leave-one-out-cross-validation:
LOOCV is a better option than the validation set approach. Instead of splitting the entire dataset into two halves, only one observation is used for validation and the rest is used to fit the model.
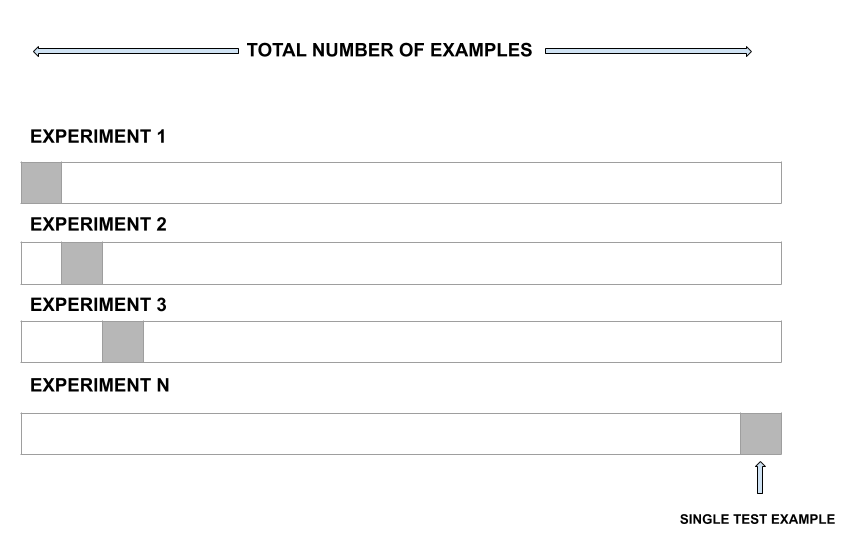
Leave one out of cross-validation
k-fold cross-validation
This approach involves randomly dividing the set of observations into k folds of nearly equal size. The first fold is treated as a validation set and the model is fit on the remaining folds. The procedure is then repeated k times, where a different group each time is treated as the validation set.
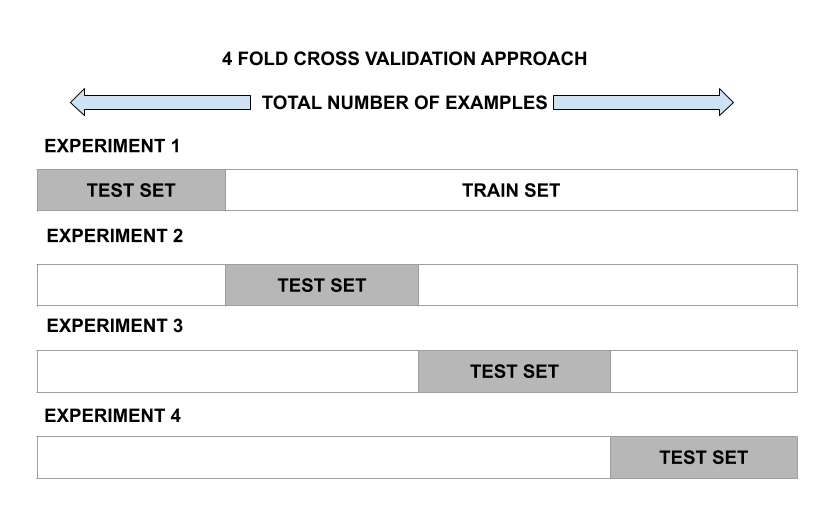
K-fold Cross-validation
Bootstrapping
Bootstrap is a powerful statistical tool used to quantify the uncertainty of a given model. However, the real power of Bootstrap is that it could get applied to a wide range of models where the variability is hard to obtain or not output automatically.
Challenges:
Algorithms in Machine Learning tend to produce unsatisfactory classifiers when handled with unbalanced datasets.
For example, Movie Review datasets
    Total Observations : 100
    Positive Dataset : 90
    Negative Dataset : 10
    Event rate : 2%
The main problem here is how to get a balanced dataset.
Challenges with standard ML algorithms:
Standard ML techniques such as Decision Tree and Logistic Regression have a bias towards the majority class, and they tend to ignore the minority class. They tend only to predict the majority class, hence, having major misclassification of the minority class in comparison with the majority class.
Evaluation of the classification algorithm as measured by a confusion matrix.
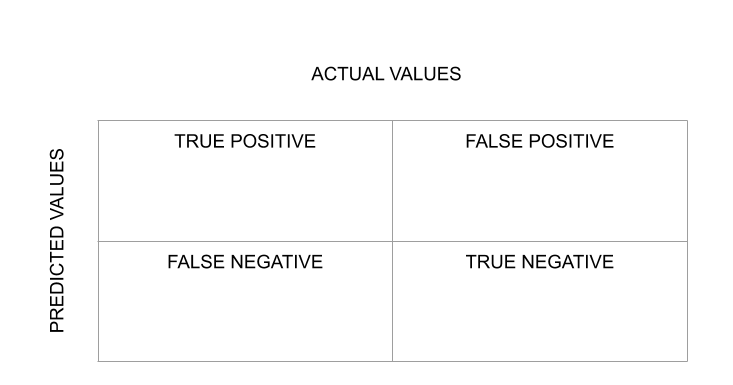
Confusion Matrix
A confusion matrix is a very useful tool for evaluating the performance of a classification model. The diagonal values of the confusion matrix represent the number of correct predictions, and therefore, higher diagonal values indicate better predictive accuracy. The off-diagonal values of the matrix represent incorrect predictions, which can provide insights into the types of errors the model is making. Overall, the confusion matrix is a valuable tool for understanding the strengths and weaknesses of a classification model and identifying areas for improvement.
Handling Approach:
- Random Over-sampling:
It aims to balance class distribution by randomly increasing minority class examples by replicating them.
For example –
    Total Observations : 100
    Positive Dataset : 90
    Negative Dataset : 10
    Event Rate : 2%
- We replicate Negative Dataset 15 times
    Positive Dataset: 90
    Negative Dataset after Replicating: 150
    Total Observations: 190
    Event Rate : 150/240= 63%
- SMOTE (Synthetic Minority Oversampling Technique) synthesizes new minority instances between existing minority instances. It randomly picks up the minority class and calculates the K-nearest neighbor for that particular point. Finally, the synthetic points are added between the neighbors and the chosen spot.
- Random Under-Sampling:
It aims to balance class distribution by randomly eliminating majority class examples.
For Example –
    Total Observations : 100
    Positive Dataset : 90
    Negative Dataset : 10
    Event rate : 2%

    We take 10% samples of Positive Dataset and combine it with Negative Dataset.

    Positive Dataset after Random Under-Sampling : 10% of 90 = 9

    Total observation after combining it with Negative Dataset: 10+9=19

    Event Rate after Under-Sampling : 10/19 = 53%
- When instances of two different classes are very close to each other, we remove the instances of the majority class to increase the spaces between the two classes. This helps in the classification process.
- Cluster-based Over Sampling:
K means clustering algorithm is independently applied to both the class instances such as to identify clusters in the datasets. All clusters are oversampled such that clusters of the same class have the same size.
For Example –
    Total Observations : 100
    Positive Dataset : 90
    Negative Dataset : 10
    Event Rate : 2%
Majority Class Cluster Before Resampling:
- Cluster 1: 20 Observations
- Cluster 2: 30 Observations
- Cluster 3: 12 Observations
- Cluster 4: 18 Observations
- Cluster 5: 10 Observations
Minority Class Cluster:
- Cluster 1: 8 Observations
- Cluster 2: 12 Observations
- After oversampling all clusters of the same class have the same number of observations.
Majority Class Cluster:
- Cluster 1: 20 Observations
- Cluster 2: 20 Observations
- Cluster 3: 20 Observations
- Cluster 4: 20 Observations
- Cluster 5: 20 Observations
Minority Class Cluster:
- Cluster 1: 15 Observations
- Cluster 2: 15 Observations
Python Implementation of Resampling Techniques:
You can download the dataset from the given link below: Dataset download. We will apply both undersampling and oversampling our dataset for balancing our target variable
Step 1: Import Libraries
Python3
import pandas as pd
import numpy as np
import seaborn as sns
from sklearn.preprocessing import StandardScaler
from imblearn.under_sampling import RandomUnderSampler, TomekLinks
from imblearn.over_sampling import RandomOverSampler, SMOTE
|
Step 2: Reading the Dataset
We will read the dataset using the pandas read_csv function. Also, we will see the percentage of each class in the target variable of the dataset.
Python3
dataset = pd.read_csv('creditcard.csv')
print("The Number of Samples in the dataset: ", len(dataset))
print('Class 0 :', round(dataset['Class'].value_counts()[0]
/ len(dataset) * 100, 2), '% of the dataset')
print('Class 1(Fraud) :', round(dataset['Class'].value_counts()[1]
/ len(dataset) * 100, 2), '% of the dataset')
|
Output:
The Number of Samples in the dataset:  284807
Class 0        : 99.83 % of the dataset
Class 1(Fraud) : 0.17 % of the dataset
Step3: Undersampling of Major class
We will do an undersampling of the major class where the cardholder is not a fraud through this technique we will reduce the rows which come under the major class.
Python3
X_data = dataset.iloc[:, :-1]
Y_data = dataset.iloc[:, -1:]
rus = RandomUnderSampler(random_state=42)
X_res, y_res = rus.fit_resample(X_data, Y_data)
X_res = pd.DataFrame(X_res)
Y_res = pd.DataFrame(y_res)
print("After Under Sampling Of Major
Class Total Samples are :", len(Y_res))
print('Class 0 :', round(Y_res.value_counts()\
[0] / len(Y_res) * 100, 2), '% of the dataset')
print('Class 1(Fraud) :', round(Y_res.value_counts()\
[1] / len(Y_res) * 100, 2), '% of the dataset')
|
Output:
After Under Sampling Of Major Class Total Samples are : 984
Class 0        : 50.0 % of the dataset
Class 1(Fraud) : 50.0 % of the dataset
We can see after doing undersampling the total data in the major class has reduced to 984.
Step4: Undersampling Using Tomelinks
We can do undersampling using the Tomelinks library.
Python3
tl = TomekLinks()
X_res, y_res = tl.fit_resample(X_data, Y_data)
X_res = pd.DataFrame(X_res)
Y_res = pd.DataFrame(y_res)
print("After TomekLinks Under Sampling Of Major\
Class Total Samples are :", len(Y_res))
print('Class 0 :', round(Y_res.value_counts()\
[0] / len(Y_res) * 100, 2), '% of the dataset')
print('Class 1(Fraud) :', round(Y_res.value_counts()\
[1] / len(Y_res) * 100, 2), '% of the dataset')
|
Output:
After TomekLinks Under Sampling Of Major Class Total Samples are : 284736
Class 0        : 99.83 % of the dataset
Class 1(Fraud) : 0.17 % of the dataset
Step5: Oversampling Using RandomOversampler
We can use RandomOversampler to oversample the minority class data. Using Random Oversample the model picks randomly data points from the existing datasets.
Python3
ros = RandomOverSampler(random_state=42)
X_res, y_res = ros.fit_resample(X_data, Y_data)
X_res = pd.DataFrame(X_res)
Y_res = pd.DataFrame(y_res)
print("After Over Sampling Of Minor Class\
Total Samples are :", len(Y_res))
print('Class 0 :', round(Y_res.value_counts()\
[0] / len(Y_res) * 100, 2), '% of the dataset')
print('Class 1(Fraud) :', round(Y_res.value_counts()\
[1] / len(Y_res) * 100, 2), '% of the dataset')
|
Output :
After Over Sampling Of Minor Class Total Samples are : 568630
Class 0        : 50.0 % of the dataset
Class 1(Fraud) : 50.0 % of the dataset
Step6: Oversampling Using SMOTE
We can use Smote to generate random sample data for the minority class. One useful thing about using SMOTE is that it creates new synthetic data points for the minority class.
Python3
sm = SMOTE(random_state=42)
X_res, y_res = sm.fit_resample(X_data, Y_data)
X_res = pd.DataFrame(X_res)
Y_res = pd.DataFrame(y_res)
print("After SMOTE Over Sampling Of Minor\
Class Total Samples are :", len(Y_res))
print('Class 0 :', round(Y_res.value_counts()\
[0] / len(Y_res) * 100, 2), '% of the dataset')
print('Class 1(Fraud) :', round(Y_res.value_counts()\
[1] / len(Y_res) * 100, 2), '% of the dataset')
|
Output:
After SMOTE Over Sampling Of Minor Class Total Samples are : 568630
Class 0        : 50.0 % of the dataset
Class 1(Fraud) : 50.0 % of the dataset
Like Article
Suggest improvement
Share your thoughts in the comments
Please Login to comment...