Line Plot in R with Error Bars
Last Updated :
24 Dec, 2021
A line plot is a graphical representation of a series of data. Line plots are widely used in data visualization. In we use ggplot2( ) and plot( ) function to create line plot. Error bars act as a visual enhancement that help us to see variability of the plotted data. Error Bars are used to show standard error, standard deviation i.e. with the help of integrated error bars in our plot we can know the estimated error.
In this article we are going to create a line plot with Error Bars and without Error Bars. We can use plot() function to create scatter plot and line plot also.
Syntax:
errbar(x, y, yplus, yminus, cap=0.015, main = NULL, sub=NULL, xlab=as.character(substitute(x)), ylab=if(is.factor(x) || is.character(x)) ” “else as.character(substitute(y)), add=FALSE, lty=1, type=’p’, ylim=NULL,pch, lwd=1, errbar.col, )
Where,
|
Sr. no.
|
Parameter
|
Description
|
Default values
|
| 1. |
x |
It holds vector of x-axis values. |
–
|
| 2. |
y |
It holds vector of y-axis values. |
–
|
| 3. |
yplus |
The top value of error bars. |
–
|
| 4. |
yminus |
The bottom value of error bars. |
–
|
| 5. |
cap |
It is the width of cap |
0.015
|
| 6. |
main |
The title of the plot |
NULL
|
| 7. |
sub |
The title of sub plot |
NULL
|
| 10. |
add |
Used to add error bars to existing plot set it to True. |
False
|
| 11. |
lty |
The line type for error bars. |
1
|
| 15. |
errbar.col |
To change the color of error bars |
black
|
Approach:
- Firstly open up your rstudio
- Type the following command and hit enter to install the dependency that will help us to draw error bars in line plots.
install.packages("Hmisc")
library(Hmisc)
- Create two data variables one for the x-axis and another for the y-axis
- Create a vector to store error values (randomly)
- Show error bars using errbar()
Example 1:
R
x = c(1,2,3,4,5,6,8)
y = c(8,6,4,5,1,7,6)
error_values = c(x)
errbar(x,y,y+error_values,y-error_values,type='b')
|
Output :
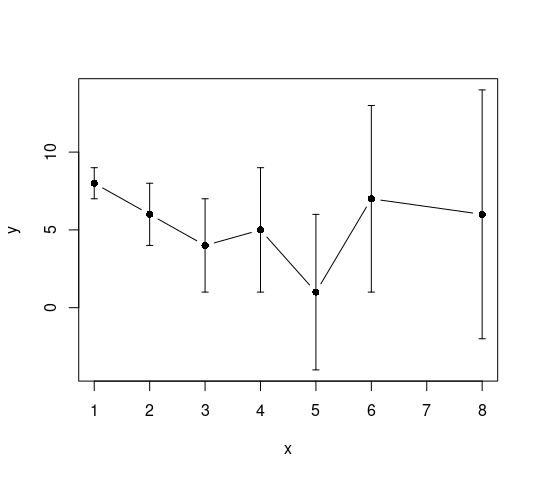
Fig. 1. Simple line plot with error bars.
Example 2:
R
x = 10:20
y = x*2.5
error_values = sqrt(y)
errbar(x,y,y+error_values,y-error_values,type="b",
col='black',cex=2,errbar.col='green',
xlab="X-axis",ylab="Y-axis",
pch="*")
|
Output:
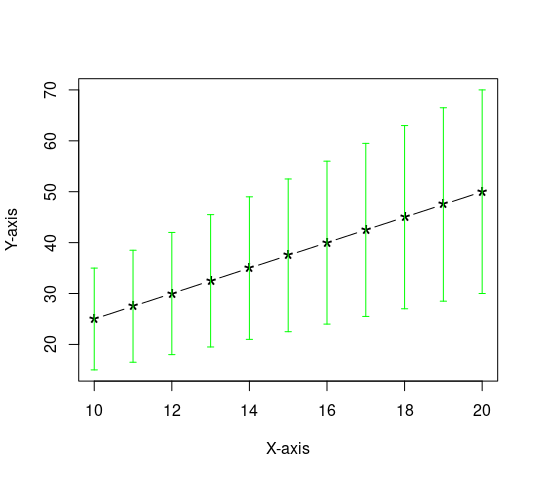
Fig. 2. Custom line plot with error bars.
Like Article
Suggest improvement
Share your thoughts in the comments
Please Login to comment...