Mark different color points on matplotlib
Last Updated :
03 Jun, 2020
Matplotlib is an amazing visualization library in Python for 2D plots of arrays. Matplotlib is a multi-platform data visualization library built on NumPy arrays and designed to work with the broader SciPy stack.
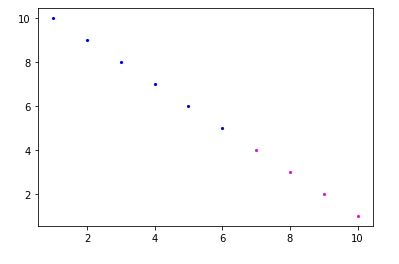
In this article, the task is to mark different color points in a graph based on a condition that the values of the elements of the list say x is less than or equal to 7 should be colored in blue and those greater should be colored magenta. The idea is to plot a graph having points grouped under one condition in different colors, basically to group the clusters in one color. For this, we run a loop for all values of x and assign a color value to the corresponding value of x. A list will be made of blue and magenta colors specifying the color at the ith index.
Below is the implementation.
import numpy as np
import matplotlib.pyplot as plt
x = np.array([1, 2, 3, 4, 5,
6, 7, 8, 9, 10])
y = np.array([10, 9, 8, 7, 6, 5,
4, 3, 2, 1])
col =[]
for i in range(0, len(x)):
if x[i]<7:
col.append('blue')
else:
col.append('magenta')
for i in range(len(x)):
plt.scatter(x[i], y[i], c = col[i], s = 10,
linewidth = 0)
plt.show()
|
Output:

Like Article
Suggest improvement
Share your thoughts in the comments
Please Login to comment...