Matplotlib is a library in Python and it is numerical – mathematical extension for NumPy library. It is an amazing visualization library in Python for 2D plots of arrays and used for working with the broader SciPy stack.
Matplotlib.axis.Tick.findobj() Function
The Tick.findobj() function in axis module of matplotlib library is used to find artist objects.
Syntax: Tick.findobj(self, match=None, include_self=True)
Parameters: This method accepts the following parameters.
- match : This parameter is the filter criterion for the matches. It default value is None.
- include_self : This parameter include self in the list to be checked for a match.
Return value: This method return the artists(list of Artist).
Below examples illustrate the matplotlib.axis.Tick.findobj() function in matplotlib.axis:
Example 1:
Python3
from matplotlib.axis import Tick
import matplotlib.pyplot as plt
from matplotlib.lines import Line2D
import numpy as np
from numpy.random import rand
fig, ax2 = plt.subplots()
ax2.bar(range(10), rand(10), picker = True)
print("Value return : \n",
*list(Tick.findobj(ax2)), sep ="\n")
fig.suptitle(
, fontweight ="bold")
plt.show()
|
Output:
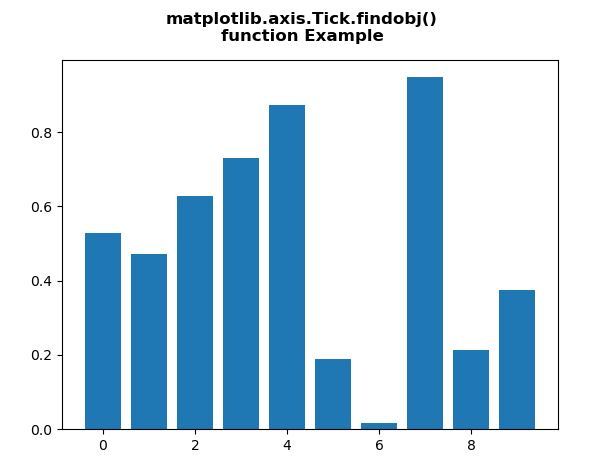
Value return :

Rectangle(xy=(-0.4, 0), width=0.8, height=0.787316, angle=0)
Rectangle(xy=(0.6, 0), width=0.8, height=0.901399, angle=0)
Rectangle(xy=(1.6, 0), width=0.8, height=0.783699, angle=0)
Rectangle(xy=(2.6, 0), width=0.8, height=0.516764, angle=0)
Rectangle(xy=(3.6, 0), width=0.8, height=0.284635, angle=0)
Rectangle(xy=(4.6, 0), width=0.8, height=0.228809, angle=0)
Rectangle(xy=(5.6, 0), width=0.8, height=0.347976, angle=0)
Rectangle(xy=(6.6, 0), width=0.8, height=0.311647, angle=0)
Rectangle(xy=(7.6, 0), width=0.8, height=0.0261189, angle=0)
Rectangle(xy=(8.6, 0), width=0.8, height=0.921416, angle=0)
Spine
Spine
Spine
Spine
Text(0.5, 0, '')
Text(1, 0, '')
Line2D()
Line2D()
Line2D((0,0),(0,1))
Text(0, 0, '')
Text(0, 1, '')
<matplotlib.axis.XTick object at 0x08917330>
Line2D()
Line2D()
Line2D((0,0),(0,1))
Text(0, 0, '')
Text(0, 1, '')
<matplotlib.axis.XTick object at 0x08917310>
Line2D()
Line2D()
Line2D((0,0),(0,1))
Text(0, 0, '')
Text(0, 1, '')
<matplotlib.axis.XTick object at 0x0A92A890>
Line2D()
Line2D()
Line2D((0,0),(0,1))
Text(0, 0, '')
Text(0, 1, '')
<matplotlib.axis.XTick object at 0x0A940D90>
Line2D()
Line2D()
Line2D((0,0),(0,1))
Text(0, 0, '')
Text(0, 1, '')
<matplotlib.axis.XTick object at 0x0A9540B0>
Line2D()
Line2D()
Line2D((0,0),(0,1))
Text(0, 0, '')
Text(0, 1, '')
<matplotlib.axis.XTick object at 0x0A9542B0>
Line2D()
Line2D()
Line2D((0,0),(0,1))
Text(0, 0, '')
Text(0, 1, '')
<matplotlib.axis.XTick object at 0x0A954570>
XAxis(80.0,52.8)
Text(0, 0.5, '')
Text(0, 0.5, '')
Line2D()
Line2D()
Line2D((0,0),(1,0))
Text(0, 0, '')
Text(1, 0, '')
<matplotlib.axis.YTick object at 0x08917A30>
Line2D()
Line2D()
Line2D((0,0),(1,0))
Text(0, 0, '')
Text(1, 0, '')
<matplotlib.axis.YTick object at 0x089176B0>
Line2D()
Line2D()
Line2D((0,0),(1,0))
Text(0, 0, '')
Text(1, 0, '')
<matplotlib.axis.YTick object at 0x0A9547B0>
Line2D()
Line2D()
Line2D((0,0),(1,0))
Text(0, 0, '')
Text(1, 0, '')
<matplotlib.axis.YTick object at 0x0A954BF0>
Line2D()
Line2D()
Line2D((0,0),(1,0))
Text(0, 0, '')
Text(1, 0, '')
<matplotlib.axis.YTick object at 0x0A954ED0>
Line2D()
Line2D()
Line2D((0,0),(1,0))
Text(0, 0, '')
Text(1, 0, '')
<matplotlib.axis.YTick object at 0x0A95E190>
YAxis(80.0,52.8)
Text(0.5, 1.0, '')
Text(0.0, 1.0, '')
Text(1.0, 1.0, '')
Rectangle(xy=(0, 0), width=1, height=1, angle=0)
AxesSubplot(0.125,0.11;0.775x0.77)
Example 2:
Python3
from matplotlib.axis import Tick
import numpy as np
import matplotlib.pyplot as plt
import matplotlib.patches as mpatches
fig, ax = plt.subplots()
x, y = 10 * np.random.rand(2, 1000)
ax.plot(x, y, 'go', alpha = 0.2)
circ = mpatches.Circle((0.5, 0.5), 0.25,
transform = ax.transAxes,
facecolor ='blue',
alpha = 0.75)
ax.add_patch(circ)
print("Value return : \n",
*list(Tick.findobj(ax)), sep ="\n")
fig.suptitle(
, fontweight ="bold")
plt.show()
|
Output:
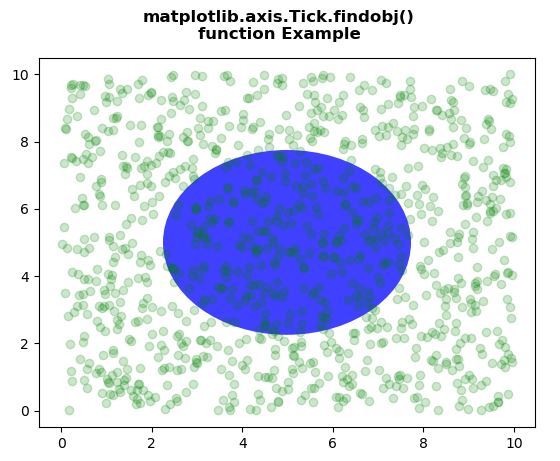
Value return :

Circle(xy=(0.5, 0.5), radius=0.25)
Line2D(_line0)
Spine
Spine
Spine
Spine
Text(0.5, 0, '')
Text(1, 0, '')
Line2D()
Line2D()
Line2D((0,0),(0,1))
Text(0, 0, '')
Text(0, 1, '')
<matplotlib.axis.XTick object at 0x080C82F0>
Line2D()
Line2D()
Line2D((0,0),(0,1))
Text(0, 0, '')
Text(0, 1, '')
<matplotlib.axis.XTick object at 0x080C82D0>
Line2D()
Line2D()
Line2D((0,0),(0,1))
Text(0, 0, '')
Text(0, 1, '')
<matplotlib.axis.XTick object at 0x0A10BCF0>
Line2D()
Line2D()
Line2D((0,0),(0,1))
Text(0, 0, '')
Text(0, 1, '')
<matplotlib.axis.XTick object at 0x0A10BE10>
Line2D()
Line2D()
Line2D((0,0),(0,1))
Text(0, 0, '')
Text(0, 1, '')
<matplotlib.axis.XTick object at 0x0A1261F0>
Line2D()
Line2D()
Line2D((0,0),(0,1))
Text(0, 0, '')
Text(0, 1, '')
<matplotlib.axis.XTick object at 0x0A126490>
Line2D()
Line2D()
Line2D((0,0),(0,1))
Text(0, 0, '')
Text(0, 1, '')
<matplotlib.axis.XTick object at 0x0A126750>
Line2D()
Line2D()
Line2D((0,0),(0,1))
Text(0, 0, '')
Text(0, 1, '')
<matplotlib.axis.XTick object at 0x0A1269F0>
XAxis(80.0,52.8)
Text(0, 0.5, '')
Text(0, 0.5, '')
Line2D()
Line2D()
Line2D((0,0),(1,0))
Text(0, 0, '')
Text(1, 0, '')
<matplotlib.axis.YTick object at 0x080C8A10>
Line2D()
Line2D()
Line2D((0,0),(1,0))
Text(0, 0, '')
Text(1, 0, '')
<matplotlib.axis.YTick object at 0x080C8690>
Line2D()
Line2D()
Line2D((0,0),(1,0))
Text(0, 0, '')
Text(1, 0, '')
<matplotlib.axis.YTick object at 0x0A126B90>
Line2D()
Line2D()
Line2D((0,0),(1,0))
Text(0, 0, '')
Text(1, 0, '')
<matplotlib.axis.YTick object at 0x0A12F0D0>
Line2D()
Line2D()
Line2D((0,0),(1,0))
Text(0, 0, '')
Text(1, 0, '')
<matplotlib.axis.YTick object at 0x0A126E70>
Line2D()
Line2D()
Line2D((0,0),(1,0))
Text(0, 0, '')
Text(1, 0, '')
<matplotlib.axis.YTick object at 0x0A126970>
Line2D()
Line2D()
Line2D((0,0),(1,0))
Text(0, 0, '')
Text(1, 0, '')
<matplotlib.axis.YTick object at 0x0A10BDB0>
Line2D()
Line2D()
Line2D((0,0),(1,0))
Text(0, 0, '')
Text(1, 0, '')
<matplotlib.axis.YTick object at 0x0A12F4D0>
YAxis(80.0,52.8)
Text(0.5, 1.0, '')
Text(0.0, 1.0, '')
Text(1.0, 1.0, '')
Rectangle(xy=(0, 0), width=1, height=1, angle=0)
AxesSubplot(0.125,0.11;0.775x0.77)
Like Article
Suggest improvement
Share your thoughts in the comments
Please Login to comment...