Matplotlib – Setting Ticks and Tick Labels
Last Updated :
26 Dec, 2020
In this article, we are going to discuss how set Ticks and Tick labels in a graph.
Ticks are the markers denoting data points on the axes and tick labels are the name given to ticks. By default matplotlib itself marks the data points on the axes but it has also provided us with setting their own axes having ticks and tick labels of their choice.
Methods used:
- plt.axes(*args, emit=True, **kwargs): For setting the axes for our plot with parameter rect as [left,bottom,width,height] for setting axes position.
- plt.axes().set_xticks() and plt.axes().set_yticks() : For setting ticks on x-axis and y-axis respectively. having data in form of a list set as parameter.
- plt.axes().set_xlabels() and plt.axes().set_ylabels() : To set labels of our ticks with parameters in form of list.
Below are some examples which depict how to add ticks and ticklabels in a plot:
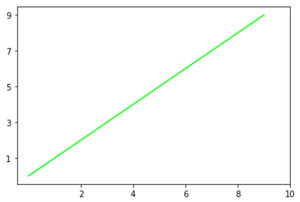
Example 1:
Python3
import matplotlib.pyplot as plt
x = y = [i for i in range(0, 10)]
ax = plt.axes()
plt.plot(x, y, color="lime")
ax.set_xticks([2, 4, 6, 8, 10])
ax.set_yticks([1, 3, 5, 7, 9])
plt.show()
|
Output:
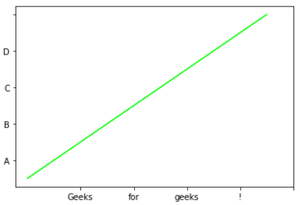
Example 2:
Python3
import matplotlib.pyplot as plt
x = y = [i for i in range(0, 10)]
ax = plt.axes()
plt.plot(x, y, color="lime")
ax.set_xticks([2, 4, 6, 8, 10])
ax.set_xticklabels(['Geeks', 'for', 'geeks', '!'])
ax.set_yticks([1, 3, 5, 7, 9])
ax.set_yticklabels(['A', 'B', 'C', 'D'])
plt.show()
|
Output:
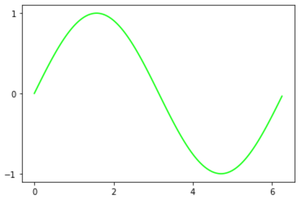
Example 3:
Python3
import matplotlib.pyplot as plt
import numpy as np
import math
x = np.arange(0, math.pi*2, 0.05)
y = np.sin(x)
ax = plt.axes()
plt.plot(x, y, color="lime")
ax.set_xticks([0, 2, 4, 6])
ax.set_yticks([-1, 0, 1])
plt.show()
|
Output:
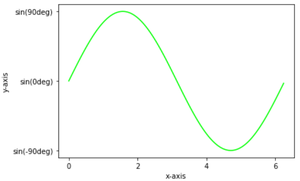
Example 4:
Python3
import matplotlib.pyplot as plt
import numpy as np
import math
x = np.arange(0, math.pi*2, 0.05)
y = np.sin(x)
ax = plt.axes()
plt.xlabel("x-axis")
plt.ylabel("y-axis")
plt.plot(x, y, color="lime")
ax.set_xticks([0, 2, 4, 6])
ax.set_yticks([-1, 0, 1])
ax.set_yticklabels(["sin(-90deg)", "sin(0deg)", "sin(90deg)"])
plt.show()
|
Output:
Like Article
Suggest improvement
Share your thoughts in the comments
Please Login to comment...