Microsoft Azure – CPU and Memory Utilization of Azure VMs in a Single Table Chart
Last Updated :
30 Mar, 2023
In this article, you will see that how you can analyze your azure virtual machine’s performance of both CPU Utilization and Memory Utilization at once using azure log queries. These KQL queries will help you to understand all the Azure VMs Performance in the form of a table chart and this will also allow you to export the data in the CSV file.
With this data, you can easily analyze, which servers need to be resized for scaling up (increasing the size) or scaling down (decreasing the size).
Advantages of using these KQL Queries:
- You can analyze the VMs in Seconds.
- Easy to filter the VMs
- Easy to filter log data by using the conditions.
- Easy to Analyse the performance between time range (Example like 7 Days, 15 Days, 2 Months, 2 Hours, 12 Hours,…etc)
- Allows us to Export the data in CSV for future reference for past performance.
Implementation:
Step 1: Login to Azure Portal.
Step 2: Go to Log Analytics Workspace >> Navigate to General Section from left menu >> Select Logs
Paste the below following KQL Query to get the Consolidated CPU and Memory Utilization in a Single Table Chart
VM CPU Utilization and MEMORY Utilization – across all the computers by OS Type equals “Windows/Linux” from the select scope
Perf
| where ObjectName == "Processor" and CounterName == "% Processor Time" and InstanceName == "_Total"
| where Computer in ((Heartbeat | where OSType == "Linux" or OSType == "Windows" | distinct Computer))
| summarize MIN_CPU = min(CounterValue), AVG_CPU = avg(CounterValue), MAX_CPU = max(CounterValue) by Computer
| join
(
Perf
| where ObjectName == "Memory"
| where CounterName == "% Used Memory" or CounterName == "% Committed Bytes In Use"
| summarize MIN_MEM = min(CounterValue), AVG_MEM = avg(CounterValue), MAX_MEM = max(CounterValue) by Computer
) on Computer
| project Computer, MIN_CPU, AVG_CPU, MAX_CPU, MIN_MEM, AVG_MEM, MAX_MEM
Output:
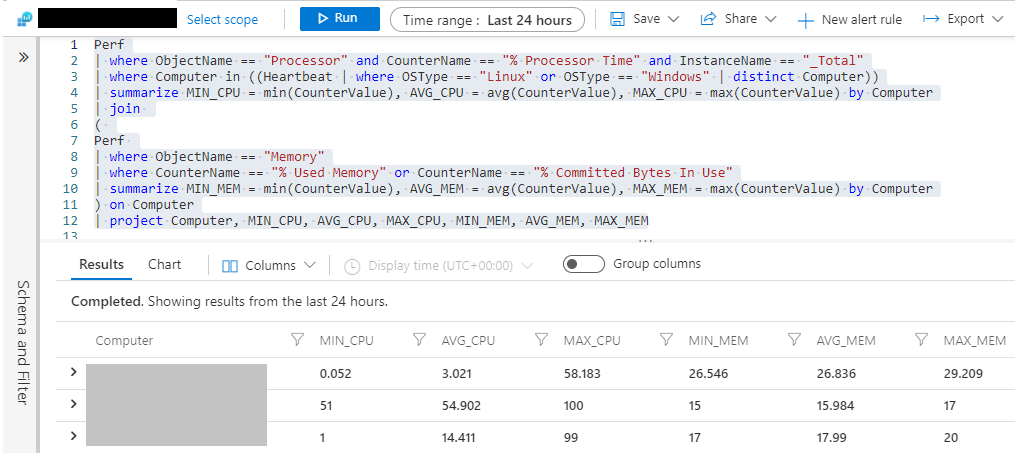
Note: You can download the table data in the form of CSV by clicking on Export
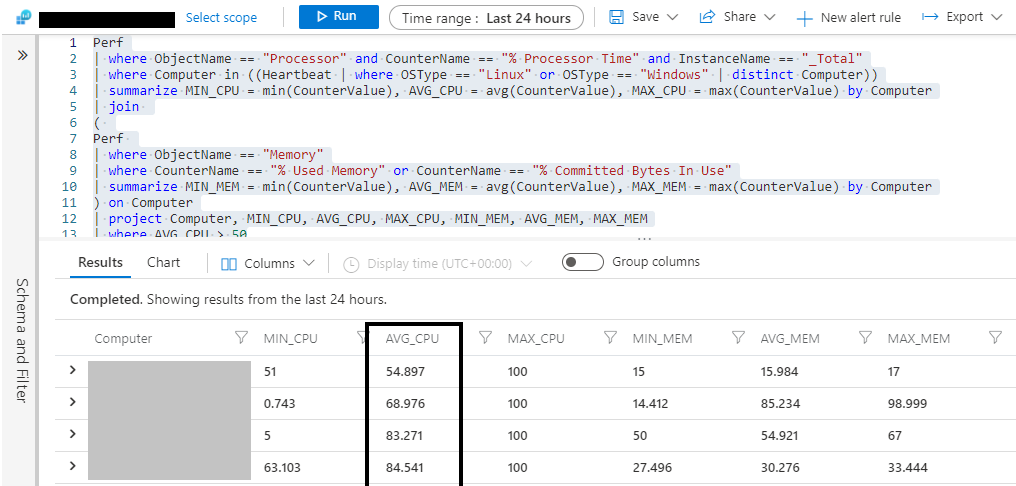
Example 1: To filter the solution based on Average CPU Utilization greater than 50%
Perf
| where ObjectName == "Processor" and CounterName == "% Processor Time" and InstanceName == "_Total"
| where Computer in ((Heartbeat | where OSType == "Linux" or OSType == "Windows" | distinct Computer))
| summarize MIN_CPU = min(CounterValue), AVG_CPU = avg(CounterValue), MAX_CPU = max(CounterValue) by Computer
| join
(
Perf
| where ObjectName == "Memory"
| where CounterName == "% Used Memory" or CounterName == "% Committed Bytes In Use"
| summarize MIN_MEM = min(CounterValue), AVG_MEM = avg(CounterValue), MAX_MEM = max(CounterValue) by Computer
) on Computer
| project Computer, MIN_CPU, AVG_CPU, MAX_CPU, MIN_MEM, AVG_MEM, MAX_MEM
| where AVG_CPU > 50
Output:
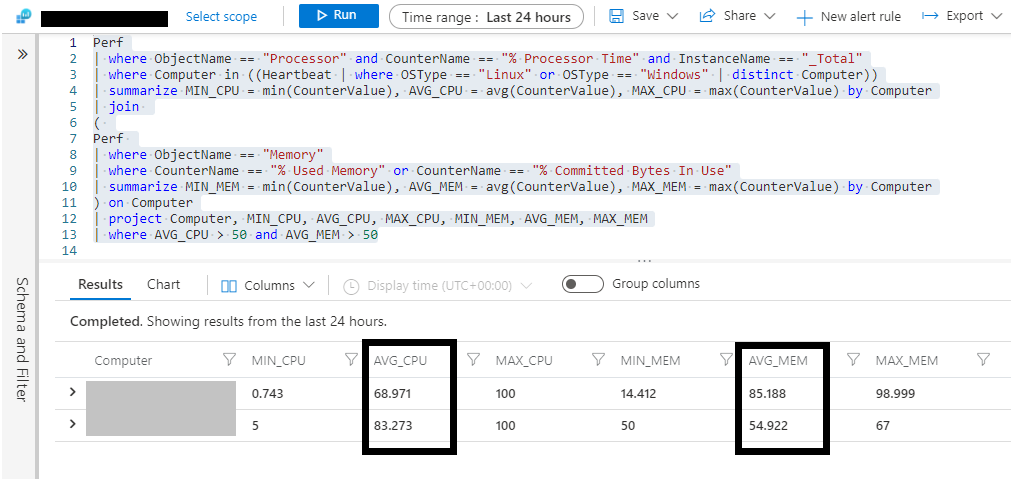
Example 2: To filter the solution based on Average CPU Utilization greater than 50% and Average Memory Utilization greater than 50 %. While we are using and in the query, the condition should satisfy both the conditions.
Perf
| where ObjectName == "Processor" and CounterName == "% Processor Time" and InstanceName == "_Total"
| where Computer in ((Heartbeat | where OSType == "Linux" or OSType == "Windows" | distinct Computer))
| summarize MIN_CPU = min(CounterValue), AVG_CPU = avg(CounterValue), MAX_CPU = max(CounterValue) by Computer
| join
(
Perf
| where ObjectName == "Memory"
| where CounterName == "% Used Memory" or CounterName == "% Committed Bytes In Use"
| summarize MIN_MEM = min(CounterValue), AVG_MEM = avg(CounterValue), MAX_MEM = max(CounterValue) by Computer
) on Computer
| project Computer, MIN_CPU, AVG_CPU, MAX_CPU, MIN_MEM, AVG_MEM, MAX_MEM
| where AVG_CPU > 50 and AVG_MEM > 50
Output:
Like Article
Suggest improvement
Share your thoughts in the comments
Please Login to comment...