ML | Implementing L1 and L2 regularization using Sklearn
Last Updated :
22 Nov, 2021
Prerequisites: L2 and L1 regularization
This article aims to implement the L2 and L1 regularization for Linear regression using the Ridge and Lasso modules of the Sklearn library of Python.
Dataset – House prices dataset.
Step 1: Importing the required libraries
Python3
import pandas as pd
import numpy as np
import matplotlib.pyplot as plt
from sklearn.linear_model import LinearRegression, Ridge, Lasso
from sklearn.model_selection import train_test_split, cross_val_score
from statistics import mean
|
Step 2: Loading and cleaning the Data
Python3
cd C:\Users\Dev\Desktop\Kaggle\House Prices
data = pd.read_csv('kc_house_data.csv')
dropColumns = ['id', 'date', 'zipcode']
data = data.drop(dropColumns, axis = 1)
y = data['price']
X = data.drop('price', axis = 1)
X_train, X_test, y_train, y_test = train_test_split(X, y, test_size = 0.25)
|
Step 3: Building and evaluating the different models
a) Linear Regression:
Python3
linearModel = LinearRegression()
linearModel.fit(X_train, y_train)
print(linearModel.score(X_test, y_test))
|
b) Ridge(L2) Regression:
Python3
cross_val_scores_ridge = []
alpha = []
for i in range(1, 9):
ridgeModel = Ridge(alpha = i * 0.25)
ridgeModel.fit(X_train, y_train)
scores = cross_val_score(ridgeModel, X, y, cv = 10)
avg_cross_val_score = mean(scores)*100
cross_val_scores_ridge.append(avg_cross_val_score)
alpha.append(i * 0.25)
for i in range(0, len(alpha)):
print(str(alpha[i])+' : '+str(cross_val_scores_ridge[i]))
|
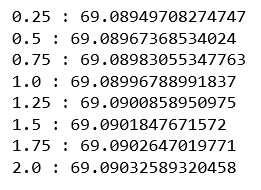
From the above output, we can conclude that the best value of alpha for the data is 2.
Python3
ridgeModelChosen = Ridge(alpha = 2)
ridgeModelChosen.fit(X_train, y_train)
print(ridgeModelChosen.score(X_test, y_test))
|
c) Lasso(L1) Regression:
Python3
cross_val_scores_lasso = []
Lambda = []
for i in range(1, 9):
lassoModel = Lasso(alpha = i * 0.25, tol = 0.0925)
lassoModel.fit(X_train, y_train)
scores = cross_val_score(lassoModel, X, y, cv = 10)
avg_cross_val_score = mean(scores)*100
cross_val_scores_lasso.append(avg_cross_val_score)
Lambda.append(i * 0.25)
for i in range(0, len(alpha)):
print(str(alpha[i])+' : '+str(cross_val_scores_lasso[i]))
|
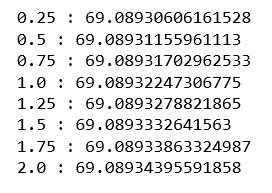
From the above output, we can conclude that the best value of lambda is 2.
Python3
lassoModelChosen = Lasso(alpha = 2, tol = 0.0925)
lassoModelChosen.fit(X_train, y_train)
print(lassoModelChosen.score(X_test, y_test))
|
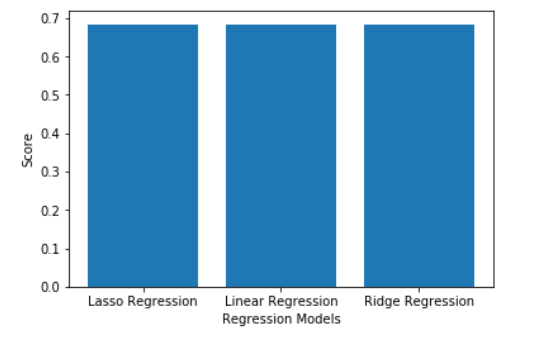
Step 4: Comparing and Visualizing the results
Python3
models = ['Linear Regression', 'Ridge Regression', 'Lasso Regression']
scores = [linearModel.score(X_test, y_test),
ridgeModelChosen.score(X_test, y_test),
lassoModelChosen.score(X_test, y_test)]
mapping = {}
mapping['Linear Regression'] = linearModel.score(X_test, y_test)
mapping['Ridge Regression'] = ridgeModelChosen.score(X_test, y_test)
mapping['Lasso Regression'] = lassoModelChosen.score(X_test, y_test)
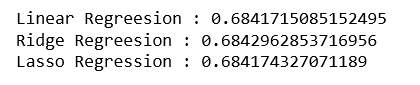
for key, val in mapping.items():
print(str(key)+' : '+str(val))
|
Python3
plt.bar(models, scores)
plt.xlabel('Regression Models')
plt.ylabel('Score')
plt.show()
|
Like Article
Suggest improvement
Share your thoughts in the comments
Please Login to comment...