Multiple barplots in R
Last Updated :
24 Sep, 2021
Bar plots are a visual representation of the grouped data. It is the most commonly used plot in data analysis activity. In multiple bar plots, we have various bar plots in the form of horizontal and vertical rectangular bars. In these multiple bar plots, the bar represents the relationship between numeric and categorical variables. Let’s learn to create a multiple bar plot with the help of the following examples.
Method 1: Using geom_bar() from ggplot2 package
The geom_bar() function is used to create bar charts for categorical data x, and histograms for continuous data y. It is inbuilt in the ggplot2 package, we don’t need to install it separately.
Syntax: geom_bar( mapping = NULL, data = NULL, stat = “count”, position = “stack”,..)
Parameter:
- mapping: mapping can be created by “aes()” i.e. aesthetic mapping in this mapping we provide the column name as an argument to map onto the plot. The default mapping in geom_bar is NULL.
- data: data is a data frame that we will be using during the plotting.
- stat: stat stands for statistics and its default value is count, i.e. we are creating bars based on the number of counts.
- position: position argument specify how the bars will be placed during the visual representation of the figure. The default value of the position is stack.
Here, the position parameter is set to an appropriate value to produce bar plots that are side by side to each other.
Example :
R
library(ggplot2)
number <- c(12,22,11,26,10,20,21,18)
gender <- c("Male","Female","Male","Female",
"Female","Male","Female","Male")
friend_or_not <- c("Unknown","Friend","Unknown",
"Friend","Unknown","Friend",
"Unknown","Friend")
circle <- data.frame(number,gender,friend_or_not)
ggplot(circle, aes(gender, number, fill = friend_or_not)) +
geom_bar(stat="identity", position = "dodge") +
labs(title="Multiple Bar plots")
|
Output:
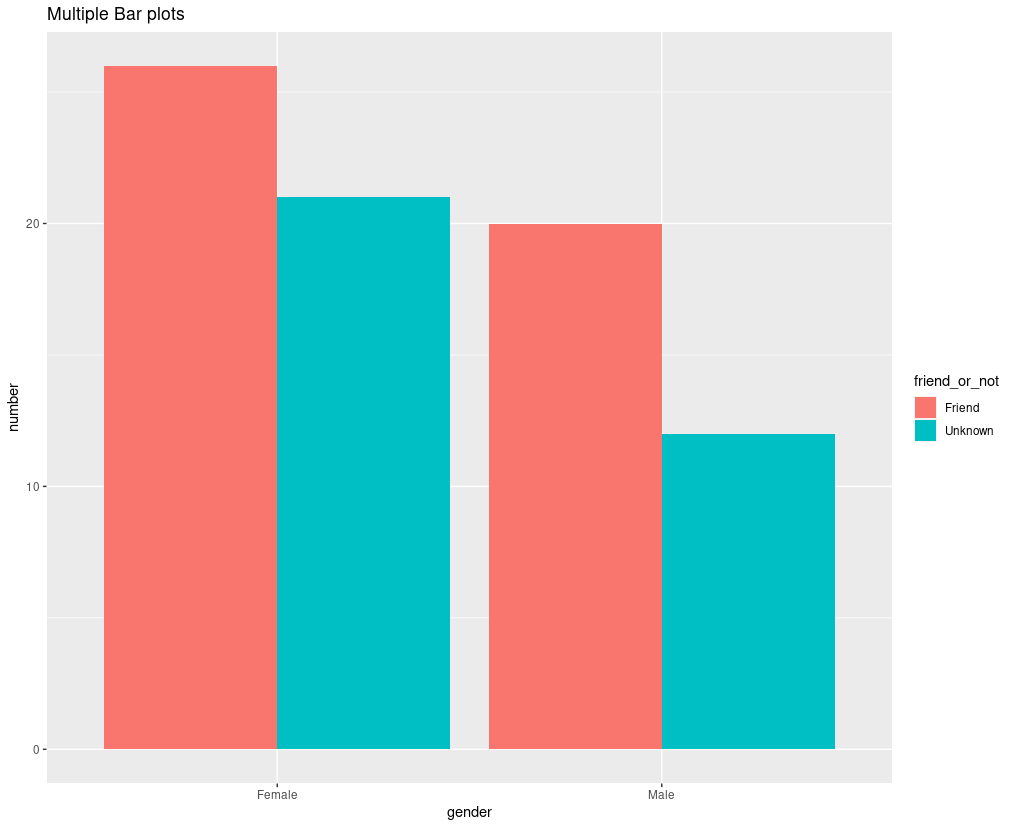
A multiple bar plot using geom_bar()
Method 2: Using the base R package barplot()
We can use barplot() function to create a Bar plot in R programming language. Below is the syntax of creating a bar plot. We can use the same bar plot syntax with some modifications to create multiple bar plots.
Syntax: barplot(data,main,xlab,ylab,..)
Parameter:
- data: data is where we put our dataset name or table name. We can also supply a vector or matrix as an argument in data.
- main: main is used to display the title of the bar chart.
- xlab: xlab takes a string as an argument and sets the x-axis label.
- ylab: ylab takes a string as an argument and sets the y-axis label.
To put the graphs, side by side, besides parameter of the boxplot() is set to TRUE.
Example:
R
barplot1=c(10,2,5,4,6,5,8,10,5,9)
barplot2=c(9,5,6,4,7,1,2,6,2,6)
barplot3=c(4,2,9,4,3,5,7,10,10,3)
data <- data.frame(barplot1,barplot2,barplot3)
barplot(as.matrix(data),
main="Multiple Bar Plots",
ylab="Count",
beside=TRUE,
)
|
Output:
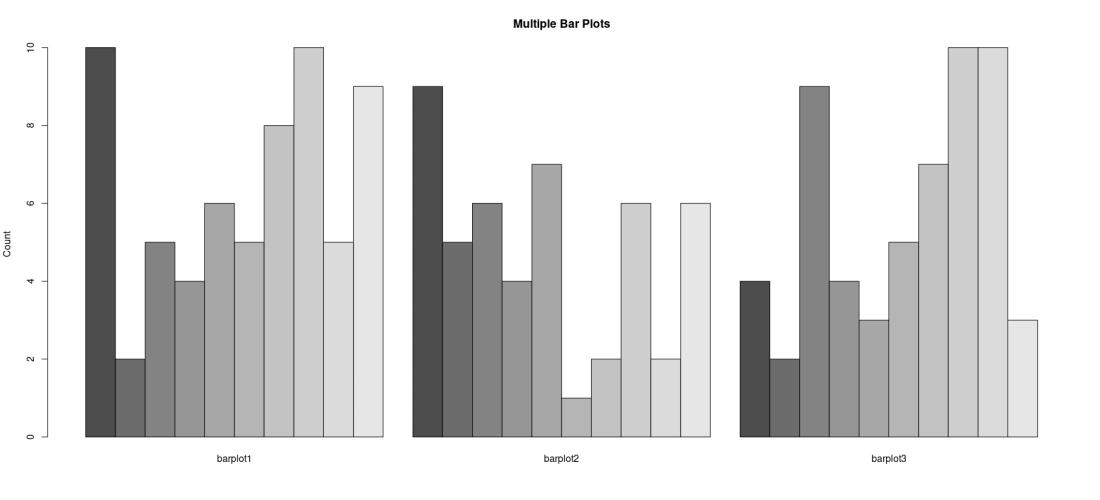
Multiple Bar plots
Like Article
Suggest improvement
Share your thoughts in the comments
Please Login to comment...