Ngrep – Network Packet Analyzer for Linux
Last Updated :
23 Aug, 2021
Ngrep a network packet analyzer that is similar to the grep command, but ngrep grep the package on the network layer. This tool grep the traffic going to coming on the network interface.ngrep allow us to specify an extended regular or hexadecimal expression to match against data payloads of packets.ngrep can work on protocols like IPv4/6, TCP, UDP, ICMPv4/6, IGMP as well as Raw on a number of interfaces.
Installation
Now let’s see how to install ngrep on Linux. The ngrep is available in most of the Linux package managers. We are going to use these package managers to install ngrep. Use one of the following commands according to your operating system:
For Debian/Ubuntu/Kali Linux:
sudo apt-get install ngrep
For Arch Linux:
sudo pacman -S ngrep
For Fedora:
dnf install ngrep

Usage
After successfully installing the ngrep, now let’s see how to use the ngrep. To monitor all traffic running on the default network interface, just use the ngrep command
sudo ngrep

To stop the ngrep use the ctrl+C keys.
Filter packets based on protocols
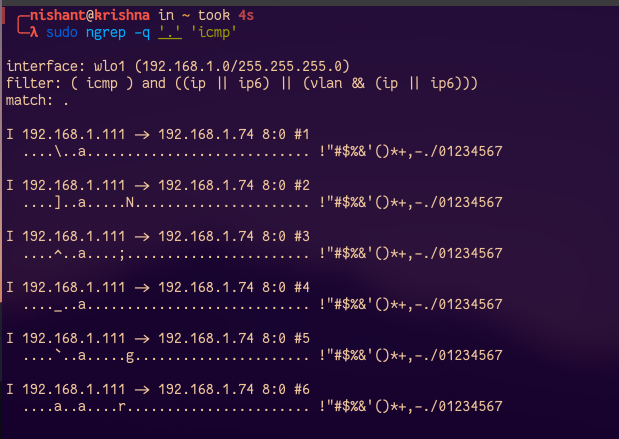
To display information about only packet header and packet payload and avoid useless information use the -q option with ngrep command. We are going to use this option in our next commands. Let’s see how we can filter the packages of a particular protocol using the ngrep. Let’s take one example, in this example, we are going to catch all ICMP packages. To use ICMP protocol we are going to send a ping to another host and then catch all ICMP packets using ngrep.
sudo ngrep -q '.' 'icmp'
Filter Packets based on host
We can also filter the packet based on the host, for example, let’s catch the packets of host google.com:
sudo ngrep -q '.' 'host google.com'

Filter packets receiving through browsers
To catch all packets that are receiving while surfing the internet through a web browser, we can use the following command:
sudo ngrep -q '^GET .* HTTP/1.1

Filter packets passing through the port
To monitor traffic passing through the port of source host or destination, use the port option and mention the port number with ngrep command:
sudo ngrep port 443

Filter packets containing the word ‘error’
To search for the occurrence of the word “error” in any network-based Syslog traffic, use the following command:
sudo ngrep -d any 'error' port 514
Using port names from file/etc/services/ instead of port
The ngrep tool can also convert the service port names stored in /etc/services to the port number that mean instead of mentioning the port number in ngrep command we can mention the port name in the /etc/services file.
sudo ngrep -d any 'error' port syslog
Filter packet on port no 80
To catch all traffic running on port number 80 we can use the following command:
sudo ngrep port 80

Get packet data in a well readable format
In the previous output, we can see that the headers are not in formatted form, this makes it difficult to read the header. To get the header in a well-formatted manner, use the following command:
sudo ngrep -W byline port 80

Get timestamp with packets
Use the -t option with ngrep command to get a timestamp in YYYY/MM/DD HH:MM:SS.UUUUUU when every time a packet is matched
sudo ngrep -t -W byline port 80

Avoiding promiscuous mode
Use the -p option to avoid putting the interface into promiscuous mode
sudo ngrep -p -W byline port 80
When observing raw or unknown protocols to show sub-protocol numbers along with single-character identifier, use the -N option with ngerp command:
sudo ngrep -N -W byline
man ngrep

Like Article
Suggest improvement
Share your thoughts in the comments
Please Login to comment...