Plot columns from list of dataframes in R
Last Updated :
22 Sep, 2021
In this article, we will discuss how to plot columns from a list of dataframes in R programming language.
Note: We are taking a line plot for implementation same can be applied to any other plot.
The ggplot() method is supplemented by different geometrical shapes to indicate the type of data plotting. The geom_line() method is used to plot the data in the form of lines.
Syntax:
geom_line()
We will be using the lapply() method in base R which applies a function, which may be user defined or pre-defined to the input data object.
Syntax:
lapply(list-of-data-frame, FUN)
Parameter :
- list-of-data-frame – The list of dataframes formed.
- FUN – The FUN here is the ggplot() method along with the mappings and geometrical plot visualizations to be used.
Let’s move to implementation, to understand the concept better.
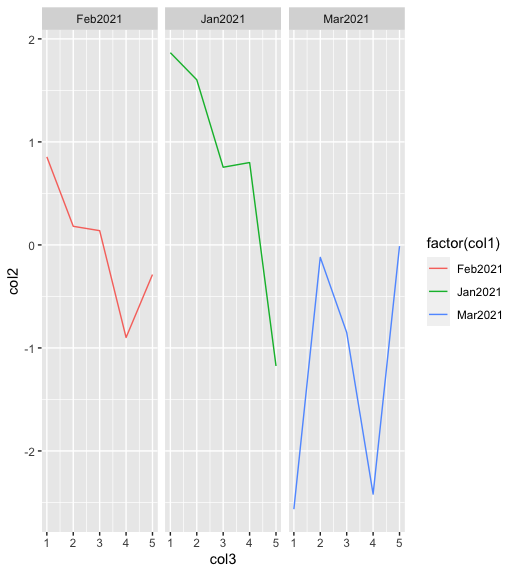
Example 1: Plot columns from a list of two dataframes
R
library("ggplot2")
data_frame1<-data.frame(col1=c(rep('Jan2021',5),
rep('Feb2021',5),
rep('Mar2021',5)),
col2=rnorm(15),
col3=rep(1:5,3)
)
data_frame2<-data.frame(col1=c(rep('Jan2021',5),
rep('Feb2021',5),
rep('Mar2021',5)),
col2=rnorm(15),
col3=rep(1:5,3)
)
data_frames<-list(data_frame1, data_frame2)
graph<-lapply(data_frames,function(x)
p<-ggplot(x,aes(x= col3,y= col2,color=factor(col1),
group=factor(col1))) +
geom_line() +
facet_wrap(~col1)
)
print (graph)
|
Output
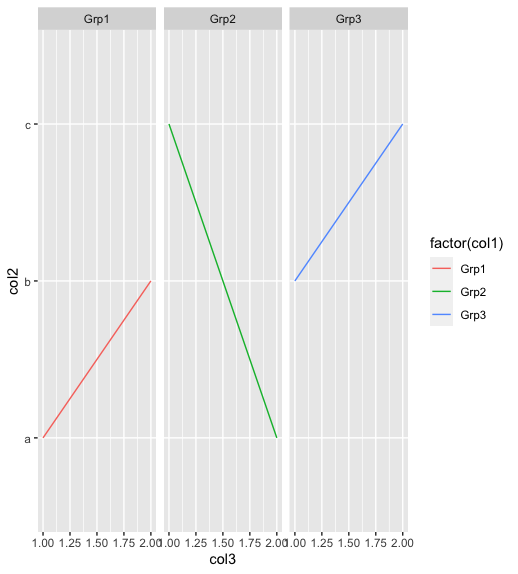
Example 2: Example to show usage of three dataframes to form the list
R
library("ggplot2")
data_frame1<-data.frame(col1=c(rep('Grp1',2),rep('Grp2',2),rep('Grp3',2)),
col2=rep(letters[1:3],2),
col3=rep(1:2,3)
)
data_frame2<-data.frame(col1=c(rep('Grp1',2),rep('Grp2',2),rep('Grp3',2)),
col2=rep(letters[1:3],2),
col3=rep(1:2,3)
)
data_frames<-list(data_frame1, data_frame2)
graph<-lapply(data_frames,
function(x)
p<-ggplot(x,aes(x= col3,y= col2,color=factor(col1),
group=factor(col1))) +
geom_line() +
facet_wrap(~col1)
)
print (graph)
|
Output
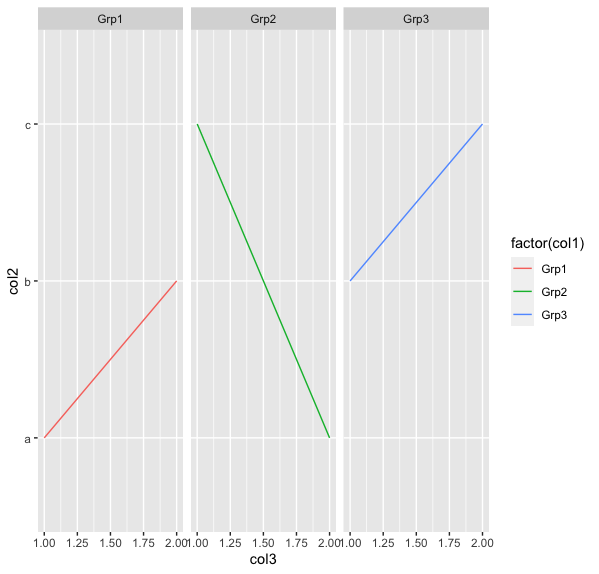
Example 3: plotting different types of dataframes
R
library("ggplot2")
data_frame1<-data.frame(col1=c(rep('Jan2021',5),rep('Feb2021',5),rep('Mar2021',5)),
col2=rnorm(15),
col3=rep(1:5,3)
)
data_frame2<-data.frame(col1=c(rep('Grp1',2),rep('Grp2',2),rep('Grp3',2)),
col2=rep(letters[1:3],2),
col3=rep(1:2,3)
)
df<-list(data_frame1, data_frame2)
graph<-lapply(df,
function(x)
p<-ggplot(x,aes(x= col3,y= col2,color=factor(col1),
group=factor(col1))) +
geom_line() +
facet_wrap(~col1)
)
print (graph)
|
Output
Like Article
Suggest improvement
Share your thoughts in the comments
Please Login to comment...