plotly.figure_factory.create_choropleth() function in Python
Last Updated :
26 Jul, 2020
Plotly library of Python can be very useful for data visualization and understanding the data simply and easily.
plotly.figure_factory.create_choropleth
A Choropleth Map is a map composed of colored polygons. It is used to represent spatial variations of a quantity.
Syntax: plotly.figure_factory.create_choropleth(fips, values, scope=[‘usa’], binning_endpoints=None, colorscale=None, order=None, legend_title=”, **layout_options)
Parameters:
fips ((list)) – it describes the list of FIPS values which correspond to the con catination of state and county ids.
values ((list)) – These are the values that will determine how the counties are colored.
scope ((list)) – it describes the list of states and/or states abbreviations. Fits all states in the camera tightly.
binning_endpoints ((list)) – it describes the ascending numbers which implicitly define real number intervals which are used as bins.
colorscale ((list)) – it is a list of colors with length equal to the number of categories of colors.
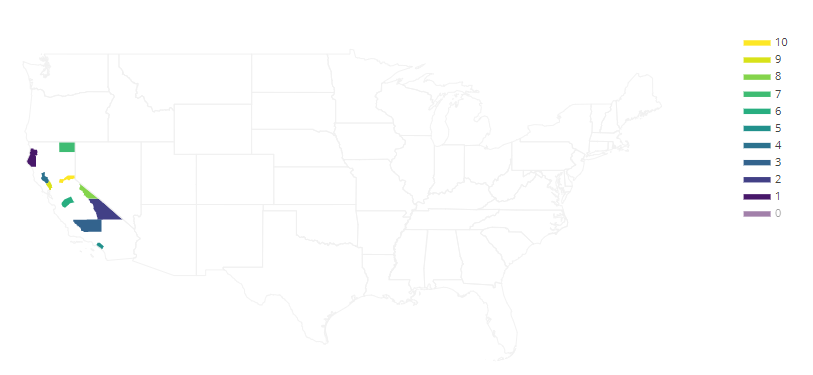
Example: Choropleth a few counties in California
Python3
import plotly.figure_factory as ff
fips = ['06021', '06023', '06027',
'06029', '06033', '06059',
'06047', '06049', '06051',
'06055', '06061']
values = range(len(fips))
fig = ff.create_choropleth(fips=fips, values=values)
fig.layout.template = None
fig.show()
|
Output:
Like Article
Suggest improvement
Share your thoughts in the comments
Please Login to comment...