Python | Pandas dataframe.std()
Last Updated :
22 Oct, 2019
Python is a great language for doing data analysis, primarily because of the fantastic ecosystem of data-centric python packages. Pandas is one of those packages and makes importing and analyzing data much easier.
Pandas dataframe.std() function return sample standard deviation over requested axis. By default the standard deviations are normalized by N-1. It is a measure that is used to quantify the amount of variation or dispersion of a set of data values. For more information click here
Syntax : DataFrame.std(axis=None, skipna=None, level=None, ddof=1, numeric_only=None, **kwargs)
Parameters :
axis : {index (0), columns (1)}
skipna : Exclude NA/null values. If an entire row/column is NA, the result will be NA
level : If the axis is a MultiIndex (hierarchical), count along a particular level, collapsing into a Series
ddof : Delta Degrees of Freedom. The divisor used in calculations is N – ddof, where N represents the number of elements.
numeric_only : Include only float, int, boolean columns. If None, will attempt to use everything, then use only numeric data. Not implemented for Series.
Return : std : Series or DataFrame (if level specified)
For link to the CSV file used in the code, click here
Example #1: Use std() function to find the standard deviation of data along the index axis.
import pandas as pd
df = pd.read_csv("nba.csv")
df
|

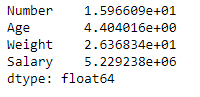
Now find the standard deviation of all the numeric columns in the dataframe. We are going to skip the NaN values in the calculation of the standard deviation.
df.std(axis = 0, skipna = True)
|
Output :
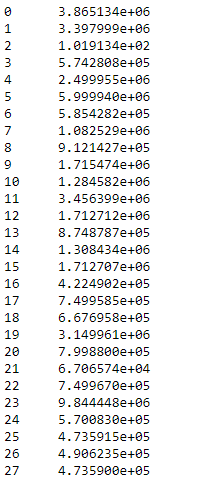
Example #2: Use std() function to find the standard deviation over the column axis.
Find the standard deviation along the column axis. We are going to set skipna to be true. If we do not skip the NaN values then it will result in NaN values.
import pandas as pd
df = pd.read_csv("nba.csv")
df.std(axis = 1, skipna = True)
|
Output :
Like Article
Suggest improvement
Share your thoughts in the comments
Please Login to comment...