Python | Tensorflow log1p() method
Last Updated :
18 Jan, 2022
Tensorflow is an open-source machine learning library developed by Google. One of its applications is to develop deep neural networks.
The module tensorflow.math provides support for many basic mathematical operations. Function tf.log1p() [alias tf.math.log1p] provides support for the natural logarithmic function in Tensorflow. It expects the input in form of complex numbers as  or floating point numbers. The input type is tensor and if the input contains more than one element, an element-wise logarithm of
  is computed,
  .
.
Syntax: tf.log1p(x, name=None) or tf.math.log1p(x, name=None)
Parameters:
x: A Tensor of type bfloat16, half, float32, float64, complex64 or complex128.
name (optional): The name for the operation.
Return type: A Tensor with the same size and type as that of x.
Code #1:
Python3
import tensorflow as tf
a = tf.constant([-1.5, -1, -0.5, 0, 0.5, 1, 1.5], dtype = tf.float32)
b = tf.log1p(a, name ='log1p')
with tf.Session() as sess:
print('Input type:', a)
print('Input:', sess.run(a))
print('Return type:', b)
print('Output:', sess.run(b))
|
Output:
Input type: Tensor("Const:0", shape=(7, ), dtype=float32)
Input: [-1.5 -1.  -0.5  0.   0.5  1.   1.5]
Return type: Tensor("log1p:0", shape=(7, ), dtype=float32)
Output: [        nan        -inf -0.6931472   0.          0.4054651   0.6931472
  0.91629076]
 denotes that natural logarithm of 1+x doesn’t exist for negative values and
  denotes that it approaches to negative infinity as the input approaches to -1.
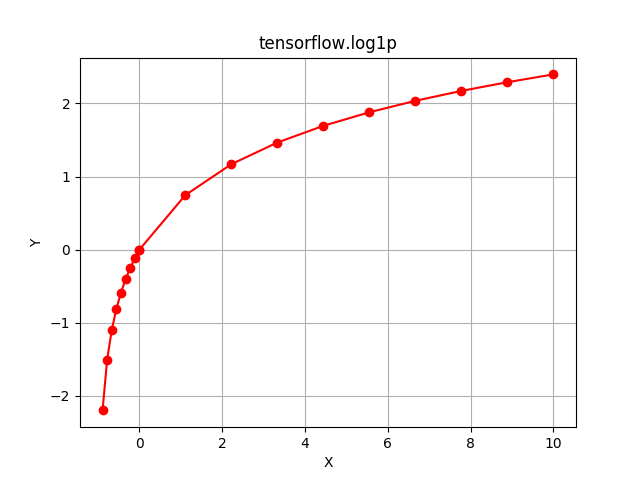
Code #2: Visualization
Python3
import tensorflow as tf
import numpy as np
import matplotlib.pyplot as plt
a = np.append(np.linspace(-1, 0, 10), np.linspace(0, 10, 10))
b = tf.log1p(a, name ='log1p')
with tf.Session() as sess:
print('Input:', a)
print('Output:', sess.run(b))
plt.plot(a, sess.run(b), color = 'red', marker = "o")
plt.title("tensorflow.abs")
plt.xlabel("X")
plt.ylabel("Y")
plt.grid()
plt.show()
|
Output:
Input: [-1.         -0.88888889 -0.77777778 -0.66666667 -0.55555556 -0.44444444
 -0.33333333 -0.22222222 -0.11111111  0.          0.          1.11111111
  2.22222222  3.33333333  4.44444444  5.55555556  6.66666667  7.77777778
  8.88888889 10.        ]
Output: [       -inf -2.19722458 -1.5040774  -1.09861229 -0.81093022 -0.58778666
 -0.40546511 -0.25131443 -0.11778304  0.          0.          0.7472144
  1.17007125  1.46633707  1.69459572  1.88031287  2.03688193  2.17222328
  2.29141179  2.39789527]
Like Article
Suggest improvement
Share your thoughts in the comments
Please Login to comment...