Rotate Axis Labels of Base R Plot
Last Updated :
31 Aug, 2021
In this article, we are going to rotate the axis labels of the plot in the R programming language.
To do this the user just needs to call the base function plot and use the las argument of this function with the specific values into it and this will be leading to the rotation of the labels of the plot as per the las argument value passed in the R programming language.
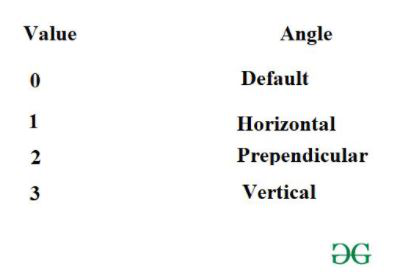
Values of the las argument as per the rotation angle:
Plot function: This is a generic function for plotting R objects
Syntax: plot(x, y,las …)
Parameters:
- x: the x coordinates of points in the plot
- y: the y coordinates of points in the plot
- las – A numeric value indicating the orientation of the tick mark labels and any other text added to a plot after its initialization
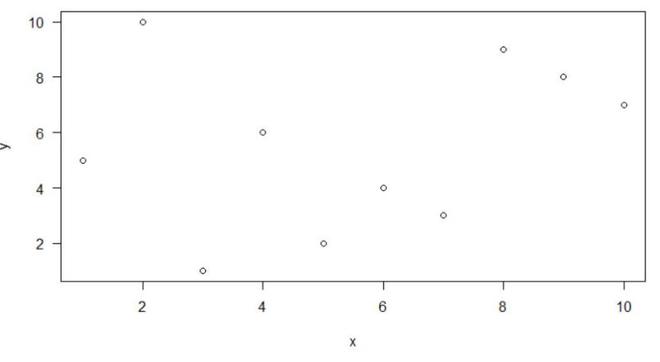
Rotate axis labels horizontally
In this example, we will be rotating the axis labels of the base R plot of 10 data points to the horizontal position by the use of the plot function with the las argument with its value as 1 in the R programming language.
R
x = c(2, 7, 9, 1, 4, 3, 5, 6, 8, 10)
y = c(10, 3, 8, 5, 6, 1, 2, 4, 9, 7)
plot(x, y, las=1)
|
Output:
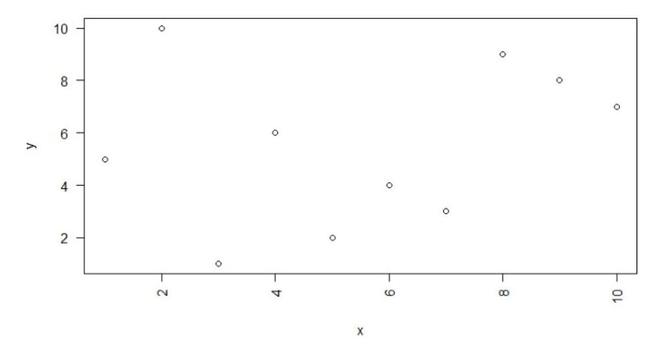
Rotate axis labels perpendicular to the axis
In this example, we will be rotating the axis labels of the base R plot of 10 data points same as used in the previous example to the perpendicular position by the use of the plot function with the las argument with its value as 2 in the R programming language.
R
x = c(2, 7, 9, 1, 4, 3, 5, 6, 8, 10)
y = c(10, 3, 8, 5, 6, 1, 2, 4, 9, 7)
plot(x, y, las=2)
|
Output:
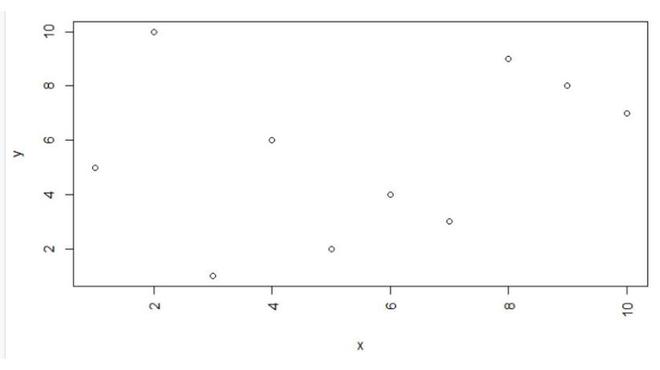
Rotate axis labels vertical to the axis
In this example, we will be rotating the axis labels of the base R plot of 10 data points same as used in the previous example to the vertical position by the use of the plot function with the las argument with its value as 3 in the R programming language.
R
x = c(2, 7, 9, 1, 4, 3, 5, 6, 8, 10)
y = c(10, 3, 8, 5, 6, 1, 2, 4, 9, 7)
plot(x, y, las=3)
|
Output:
Like Article
Suggest improvement
Share your thoughts in the comments
Please Login to comment...