Spacing between boxplots in ggplot2 in R
Last Updated :
18 Jul, 2021
In this article, we are going to see how to add space between the boxplots in ggplot2 using R programming language.
Dataset in use: Crop_recommendation
Method 1: Using width between boxplot
Here we will use width attributes to define space between the boxplot. In this the value is passed to the attribute.
Syntax: geom_boxplot(width)
Program:
R
library(ggplot2)
df <- read.csv("Crop_recommendation.csv", header = TRUE)
plot = ggplot(data=df,
mapping=aes(
x=label, y=temperature))+
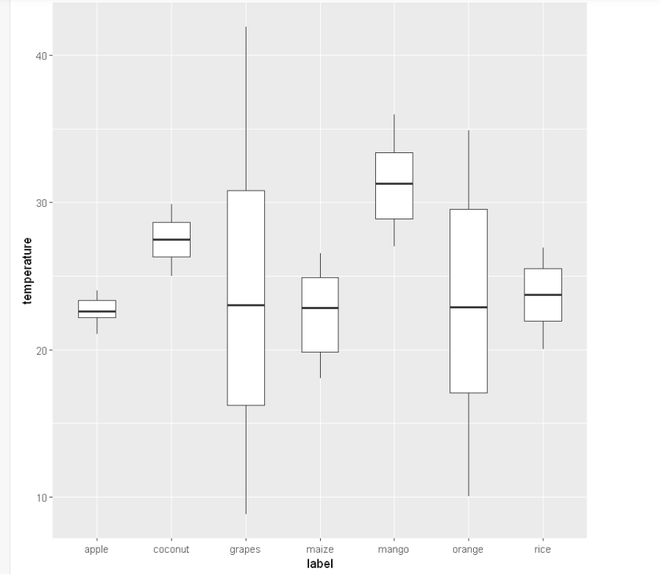
geom_boxplot(width = 0.5)
plot
|
Output:
Method 2: Using position_dodge
Here we will use position_dodge to define the vertical position of a geom while adjusting the horizontal position. position_dodge() requires the grouping variable to be specified position.
Syntax:
geom_boxplot( position = position_dodge(width))
Program:
Python3
library(ggplot2)
df <- read.csv("Crop_recommendation.csv", header = TRUE)
plot= ggplot(data=df,
mapping=aes(x=label,
y=temperature))+
geom_boxplot(width=0.1, position = position_dodge(width=0.5))
plot
|
Output:
Like Article
Suggest improvement
Share your thoughts in the comments
Please Login to comment...