What is a Swimlane Diagram
Last Updated :
20 Feb, 2024
A swimlane diagram is also called a cross-functional diagram. The name, cross-functional process map, means the whole work process “crosses” several functions. By using swimlane diagrams in system design, you can create a clear and concise representation of your system architecture, promoting better understanding, collaboration, and ultimately, a more robust and efficient system. In this article, we will discuss the what is swimlane diagram, its benefits, attributes, elements, and steps to draw a swimlane diagram.

Important Topics for the Swimlane Diagram
1. What is Swimlane Diagram?
In the context of system design, a swimlane diagram is a powerful tool for visualizing the interactions and responsibilities between different components within a system element like microservices, APIs, databases and external system.
A swimlane diagram is a popular tool for visualizing processes, but its journey to becoming a staple in various fields, including system design, has been an interesting evolution.
- Swimlane diagrams and swimlane flowcharts are essentially the same thing.
- Both terms refer to a type of flowchart that uses horizontal or vertical lanes to show the different steps in a process and who is responsible for each step.
2. Attributes in the Swimlane Diagram
Here we will discuss the Attributes of individual elements within the diagram
|
Name
|
Symbol
|
Description
|
|
Start/End
|

|
It indicates the start and end point in the flowchart
|
|
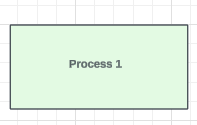
Process 1
|
|
It indicates a process, action, or operation.
|
|
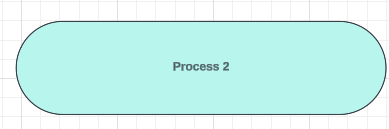
Process 2
|
|
It indicates an automatic process that triggers another action.
|
|
Process 3
|

|
It indicates a setup to a subsequent step in a process.
|
|
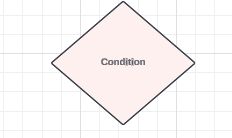
Condition
|
|
It indicates a question.
|
|
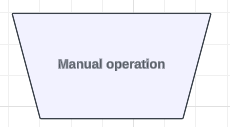
Manual Operation
|
|
It indicates that the user must manually input information into the system.
|
|
Display
|

|
It indicates that information must be displayed. |
|
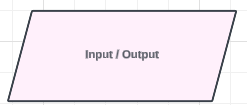
Input / Output
|
|
It indicates that information should be entered in or should come out of the flow. |
|
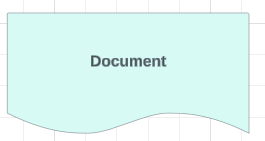
Document
|
|
It indicates a document or report that is involved in the process.
|
|
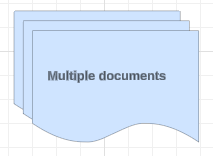
Multiple Document
|
|
It indicates that there are multiple documents involved in the flow.
|
|
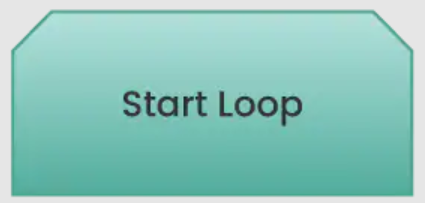
Start Loop
|
|
It indicates the beginning of a loop.
|
|
End Loop
|

|
It indicates the point at which the loop ends.
|
Here, we will discuss about the Oil Change Example we will implement the step wise step flowchart.
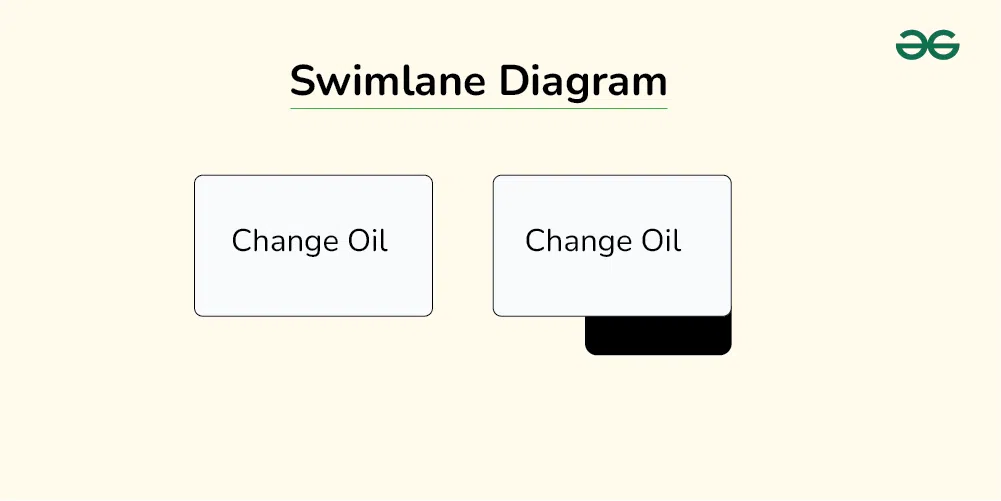
2.1 Symbol for Activity:
- Use a “box” to show the activities within a workflow or process. Shade the box if you have a separate map or flowchart of this activity.
- Different shapes in a swimlane diagram can have specific meanings and attributes assigned to them. For example, a diamond might represent a decision point, while a rectangle might represent a simple task.
2.2 Symbol of Input and Output
- Draw a line with an arrow to show an input or an output associated with each activity.
- Label the inputs and outputs. This helps with subsequent interpretation.
- The input should be the resource that the activity transforms. You should be able to see the transformation, and the value-creating work of an activity reflected in the progression of outputs throughout the workflow.
- Arrows connecting lanes or tasks can have attributes defining the type of interaction they represent, such as information exchange, handoff of responsibility, or conditional flow.
Note: The direction of the arrow is also the direction of the flow of work

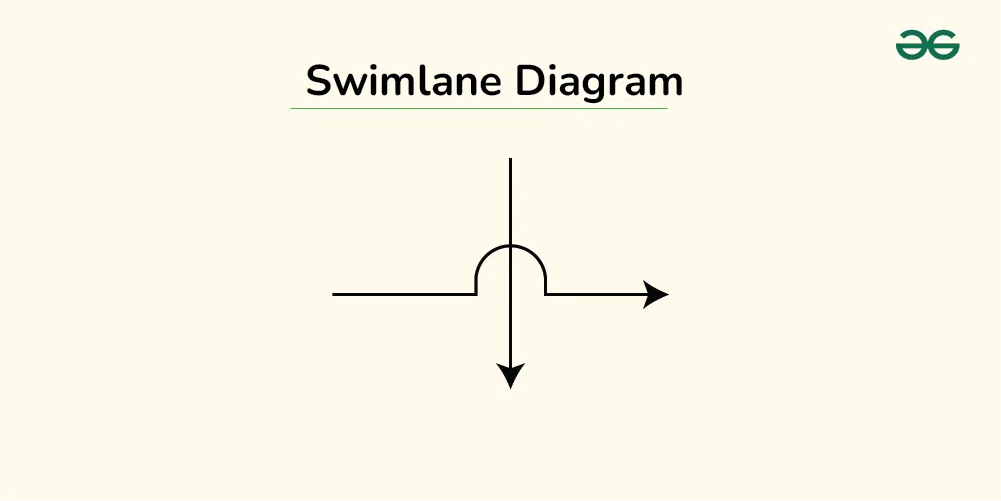
2.3 Symbol of Left to Right conversion:
- In this symbol it shows the conversion of left-to-right sequence of converting inputs into outputs.Let suppose we want to add more box then we can add it, it will show the other activity diagram.
- These describe the individuals or teams assigned to each swimlane, such as their roles, responsibilities, and expertise.

2.4 Symbol for Inputs and outputs pass over or under one another:
- Arrows representing inputs or outputs should pass over or under one another, rather than intersect.
- Change Oil “input” to, or “output” from Spent Oil Replacement Oil Symbols for inputs and outputs.
2.5 Symbol for decision with two branches
Use the diamond symbol to indicate a decision (alternate branches and paths of flow). Often there are more than two options so label all the branches.

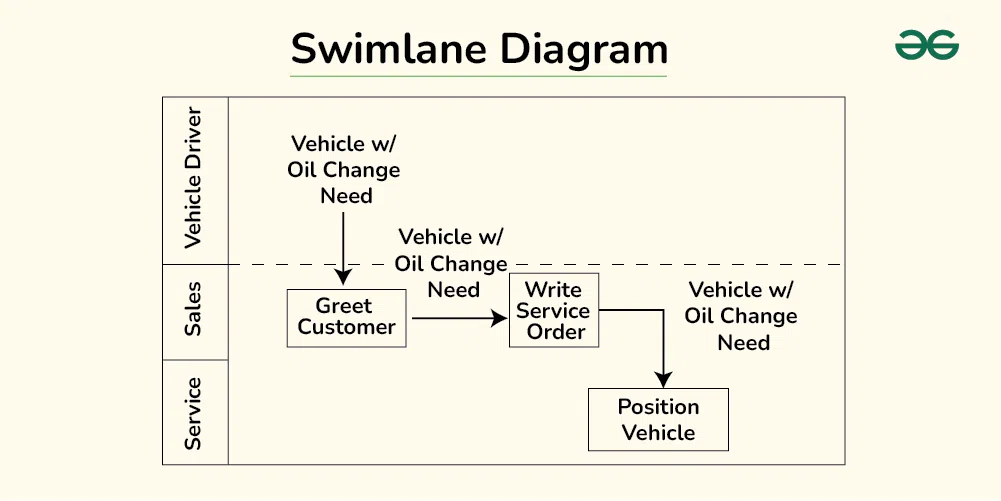
2.6 Symbol for entities
We will drwa horizontal bands (swimlanes) to represent the “entity” that does the work. Inputs and outputs pass through these bands. From the above image we will show three entities: Vehicle Driver, Sales, and Service.
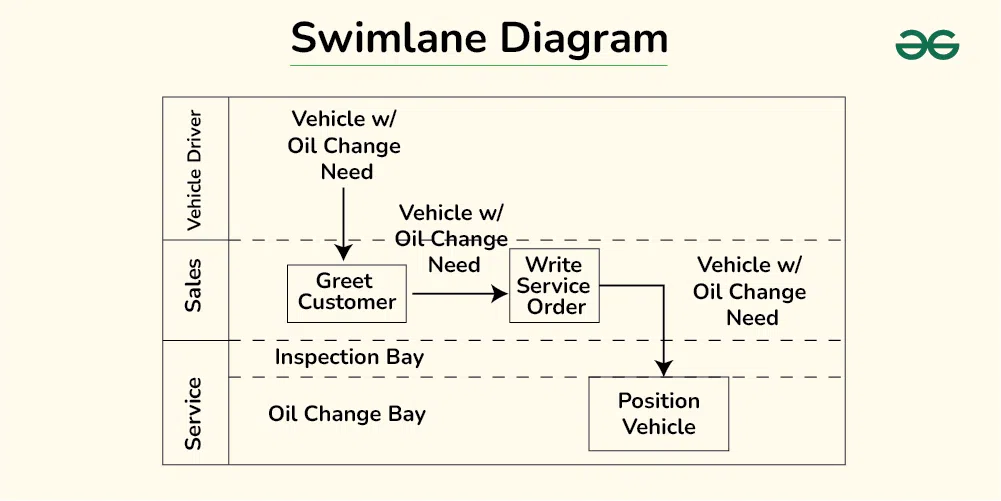
2.7 Symbol for Split Diagram
Split (subdivide) the band if you want to show a subset of similar work within the same entity. In the diagram we can see the Inspection and Oil Change Bay is the subset.
3. Entities of Swimlane Diagram:
Swimlane diagrams are built around the concept of entities, which represent individuals, teams, departments, systems, or even external stakeholders involved in a process. These entities play a crucial role in the diagram’s clarity and effectiveness. Here’s a breakdown of the different types of entities you might encounter in a swimlane diagram:
- Participants:
- Individuals: This is the most granular level, where specific people are assigned tasks or responsibilities within a swimlane.
- Teams: Groups of individuals working together are often represented as a single entity with a shared swimlane.
- Departments: Larger organizational units like departments can be used as entities, encompassing multiple teams or individuals with distinct roles.
- Systems and Tools:
- Software applications, databases, or other technological tools can be considered entities if they play a significant role in the process and require interaction from participants.
- External services or vendors used within the process can also be included as entities.
- Abstract Entities:
- Roles or positions within an organization can be treated as entities if the tasks are not necessarily assigned to specific individuals but rather to whoever holds that role.
- Concepts or stages in a more abstract process can also be represented as entities to highlight their importance and flow within the diagram.
- Choosing the right entities:
- The complexity of a process and the desired level of detail will determine which entities are most relevant to include in a swimlane diagram.
- It’s crucial to keep the audience in mind and choose entities that are familiar and meaningful to them.
- Focusing on entities that have distinct roles and responsibilities will enhance the clarity and communication value of the diagram.
4. Steps to draw Swimlane Diagram
Creating a swimlane diagram can be a great way to visually represent and understand complex processes. Here’s a breakdown of the steps involved:
Step-1: Define the process and participants:
- Identify the process you want to map. What are the main steps involved? What are you trying to achieve?
- Determine the participants. Who are the different individuals or teams involved in each step of the process?
Step-2: Create the swimlanes:
- Draw horizontal or vertical lanes across your canvas. Each lane should represent a participant or group responsible for a specific set of tasks.
- Label each lane clearly with the participant’s name or role.
Step-3: Map the process steps:
- Within each lane, list the tasks or activities performed by that participant. Use simple shapes like rectangles or rounded rectangles to represent tasks.
- Connect the tasks with arrows to show the flow of the process. Use different arrow styles to indicate different types of interactions, like handoffs or decisions.
Step-4: Add details and formatting:
- Include additional information, such as durations, decision points, or inputs and outputs. You can use diamonds for decisions, ovals for start and end points, and parallelograms for inputs and outputs.
- Customize the appearance of your diagram. Use different colors, fonts, and line styles to make it visually appealing and easy to understand.
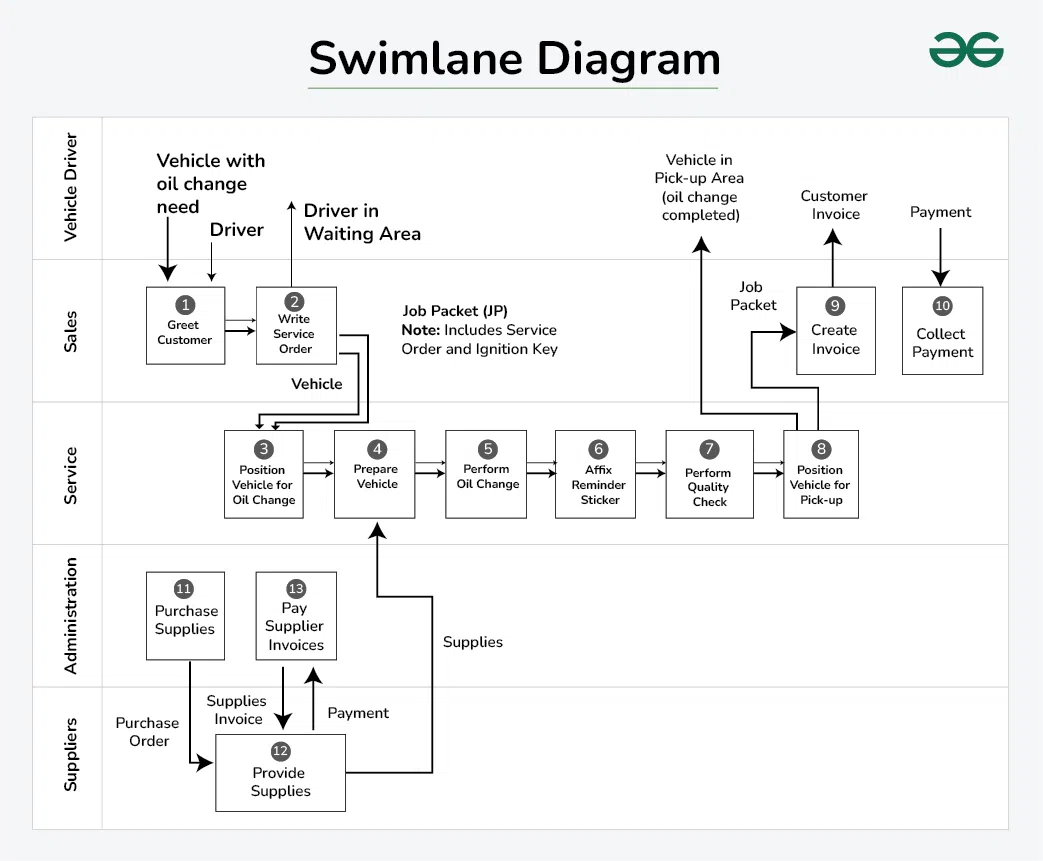
Problem Statement:
Here, we will discuss about the oil changer flowchart for understanding the swimlane diagram flowchart:
- Someone from Sales greets the customer, discusses the work to be done, writes a service order, and confirms with the customer the work to be done.
- Sales gives the service order to the next available oil change Service tech, who reviews it and prepares to start the job. He takes the keys out of the job packet, locates the customer’s car, and moves it to the oil change bay.
- Then, he prepares the vehicle for an oil change. Next, he changes the oil. Then, he places a reminder sticker on the front windshield of the car, and does a quality check.
- Once he confirms that everything is okay, he moves the car to the pick-up area, and notifies Sales that the job is complete. At this point, he returns the job packet to the Sales person who wrote the service order.
- Once the Service technician notifies Sales, they prepare the bill for the customer and collect payment.
Overall Diagram by using Swimlane Diagram:
Choosing the right tool for creating swimlane diagrams depends on your needs and budget. Here are some popular options, categorized by type:
- Online Collaboration Tools:
- ClickUp: Offers a whiteboard feature with drag-and-drop swimlane templates and real-time collaboration.
- Lucidchart: A popular online diagramming tool with intuitive swimlane functionality and extensive templates.
- Swimlanes: Web-based tool specifically designed for creating swimlane diagrams, with powerful features and integrations.
- Diagramming Software:
- Microsoft Visio: A classic desktop diagramming tool with built-in swimlane templates and advanced customization options.
- Visual Paradigm Online: Offers both online and desktop versions with various diagram types, including swimlanes.
- Creately: Affordable online diagramming tool with basic swimlane functionality and easy-to-use interface.
- Paid Tools:
- Lucidchart: A popular online diagramming tool with a rich feature set, including swimlane diagrams with advanced formatting options, real-time collaboration, and integrations with other tools.
- Visio: Microsoft’s diagramming software known for its powerful features and professional look. It offers pre-made swimlane templates and advanced customization options, but comes with a hefty price tag.
- ClickUp: A project management tool with a built-in whiteboard feature that allows you to create swimlane diagrams and other visuals. It’s a great option if you already use ClickUp for project management.
6. Why the Swimlane Diagram is useful
Swimlane diagram is a flowchart that visually breaks down a process into steps or activities, each assigned to a specific participant or team. They are often used in business to map out workflows, procedures, and cross-functional collaborations. Here are some of the benefits of using swimlane diagrams:
- Improved Clarity and Communication:
- Swimlane diagrams provide a clear and concise visual representation of a process, making it easier for everyone involved to understand the steps, dependencies, and handoffs.
- Enhanced Efficiency and Productivity:
- Swimlane diagrams can help to identify bottlenecks and inefficiencies in a process. By seeing how different steps interact, it is easier to spot areas where things are slowing down or where there is duplication of effort.
- Once inefficiencies are identified, they can be addressed and eliminated, leading to a more streamlined and efficient process.
- Documentation and Training:
- Swimlane diagrams can be used as a form of documentation, providing a clear and concise reference for anyone who needs to understand a process.
- They can also be used for training purposes, helping new employees to quickly learn the ropes.
- Optimized efficiency and problem-solving:
- Bottleneck identification: Swimlane diagrams highlight handoffs and dependencies between different roles, making it easier to identify bottlenecks and areas for improvement. This allows for streamlining processes and eliminating unnecessary delays.
- Reduced redundancies: The visual representation can reveal duplication of efforts across different lanes, prompting opportunities for consolidation and optimization.
- Enhanced communication: By providing a shared visual reference, swimlane diagrams facilitate communication between teams and departments, leading to smoother collaboration and problem-solving.
7. Uses of Swimlane Diagram
Swimlane diagrams have a broad range of applications and can be used for various purposes across different industries. Here are some common use cases:
- Process Mapping and Improvement:
- Visualize and analyze existing workflows to identify bottlenecks, inefficiencies, and redundancies.
- Design and communicate optimized processes with clearly defined roles and responsibilities.
- Track progress and measure the effectiveness of process improvements.
- Project Management:
- Plan and manage complex projects by breaking them down into manageable tasks and assigning them to different teams or individuals.
- Clearly communicate dependencies and handoffs between different project phases.
- Monitor progress and identify potential risks or delays.
- Business Process Documentation:
- Standardize and document standard operating procedures (SOPs) for internal reference and training.
- Improve consistency and quality by ensuring everyone follows the same process steps.
Like Article
Suggest improvement
Share your thoughts in the comments
Please Login to comment...