Visualizing the composition two of graph using networkx
Last Updated :
24 Jan, 2021
In this article, we are going to see how to visualize the composition two of the graph using networkx. If we are given two graphs A and B then their composition can be found by performing union operation on node-set and edge-set of A and B.
Simply if an edge is contained between any two vertices in any of the initial graphs it will be contained in the composition of those graphs.
Example:
Initial Graph G:
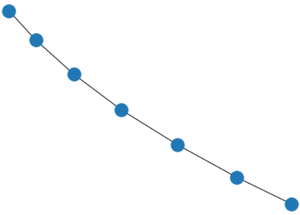
G
Initial Graph H:
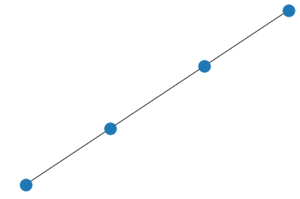
H
Result of Composition of G and H:
Composition(G,H)
Explanation: If we name nodes in both graphs G and H using integers then we will clearly observe that node and edge set of G will be superset of H and hence their union gives G in return.
Example 2:
Initial Graph G:
G
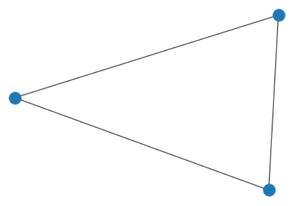
Initial Graph H:

H
Result of Composition of G and H:
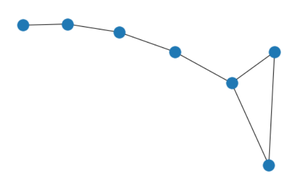
R
Explanation: We can see that all the edges which are in graph G are present in graph H except the node between first and third node from right therefore doing composition of G and H adds all edges from G and H into the result.
Important points about Compose function:
- H attributes take precedent over G attributes.
- The graph returned is of the same type as G.
- G and H should either be both directed or both undirected.
- G and H must both be graphs or multigraphs
Realizing Composition using Python :
We will use networkx.compose() function for our task to do composition of 2 graphs.
Syntax: compose(G, H)
- G: It is a networkx Graph object which is passed as an argument to compose function.
- H: It is also an networkx Graph object which is passed as an argument to compose function.
Result of compose function will be union of edge and vertices set of G and H.
Approach:
- We will import networkx with an alias nx.
- Create a sample graph object G using path_graph() function.
- Create second sample graph object H using path_graph() function.
- We will then call compose function passing G as an argument.
- We will capture the object returned by compose function in another object R.
- We will then call draw() function passing R as an argument which will display the complement graph.
Code:
Python3
import networkx as nx
G = nx.path_graph(7)
H = nx.path_graph(3)
R = nx.compose(G,H)
nx.draw(R)
|
Output:
OUTPUT
Like Article
Suggest improvement
Share your thoughts in the comments
Please Login to comment...