Zoom into ggplot2 Plot without Removing Data in R
Last Updated :
24 Oct, 2021
In this article, we will discuss how to zoom into the ggplot2 plot without removing data using ggplot2 package in the R programming language. The approaches to the zoom into ggplot2 plot without removing data are as follows:
- Zoom in to ggplot2 plot without Removing data using ylim()/xlim() function
- Zoom in to ggplot2 plot without Removing data using coord_cartesian() function
Method 1: Using ylim()/xlim() function
ylim()/xlim() function: Convenience function to set the limits of the y axis/x-axis.
Syntax:
ylim(...)
xlim(...)
Parameters:
- …: if numeric, will create a continuous scale, if factor or character, will create a discrete scale.
Example:
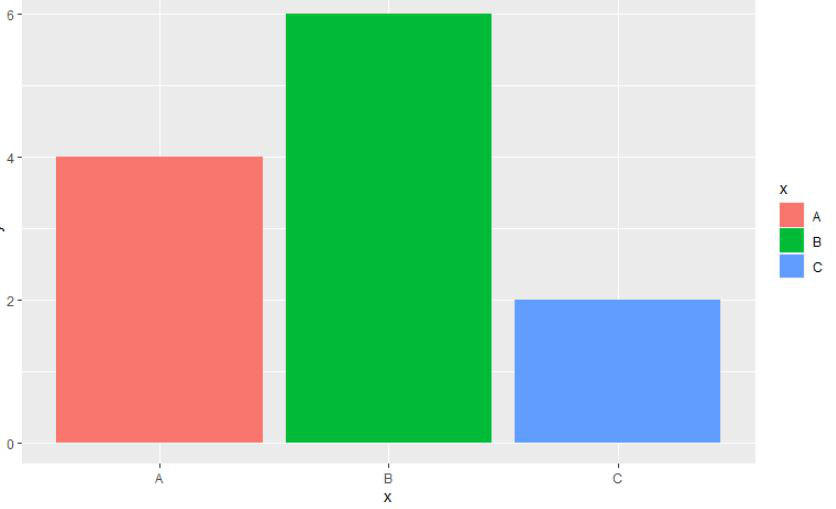
In this, example, we will be using xlim() function to get the zoom into view of the ggplot2 bar plot of the given data without removing any initial data in the R programming language.
R
library("ggplot2")
gfg < -data.frame(
x=c('A', 'B', 'C', 'D', 'E', 'F'),
y=c(4, 6, 2, 9, 7, 3))
plot < -ggplot(gfg, aes(x, y, fill=x)) +
geom_bar(stat="identity")
plot+xlim('A', 'B', 'C')
|
Output:
Method 2: Using coord_cartesian() function
The Cartesian coordinate system is the most familiar, and common, type of coordinate system. Setting limits on the coordinate system will zoom the plot (like you’re looking at it with a magnifying glass), and will not change the underlying data like setting limits on a scale will.
Syntax:
coord_cartesian( xlim = NULL, ylim = NULL,expand = TRUE, default = FALSE, clip = “on”)
Parameters:
- xlim, ylim: Limits for the x and y axes.
- expand: If TRUE, the default, adds a small expansion factor to the limits to ensure that data and axes don’t overlap.
- default: Is this the default coordinate system
- clip: Should drawing be clipped to the extent of the plot panel?
Example:
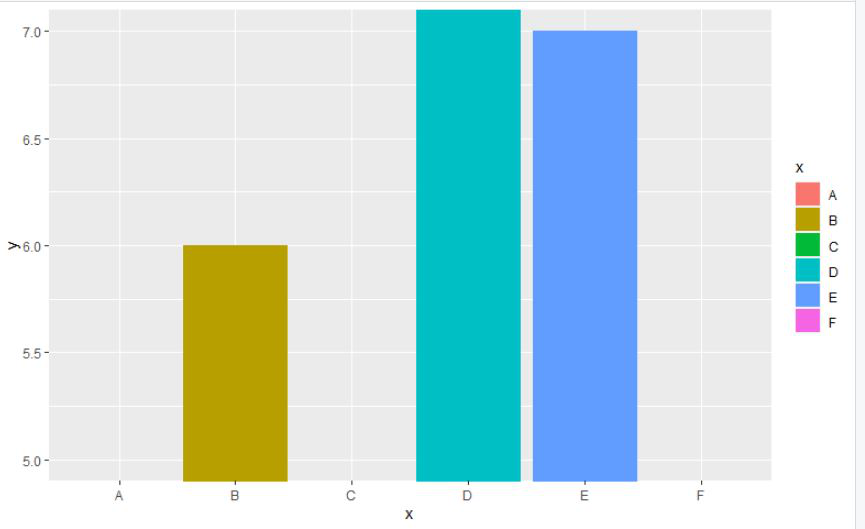
In this, example, we will be using the coord_cartesian() function with ylim() function to get the zoom into view of the ggplot2 bar plot of the given data without removing any initial data in the R programming language.
R
library("ggplot2")
gfg < -data.frame(
x=c('A', 'B', 'C', 'D', 'E', 'F'),
y=c(4, 6, 2, 9, 7, 3))
plot < -ggplot(gfg, aes(x, y, fill=x)) +
geom_bar(stat="identity")
plot+coord_cartesian(ylim=c(5, 7))
|
Output:
Like Article
Suggest improvement
Share your thoughts in the comments
Please Login to comment...