Continuous Uniform Distribution in R
Last Updated :
01 Mar, 2024
The continuous uniform distribution is also referred to as the probability distribution of any random number selection from the continuous interval defined between intervals a and b. A uniform distribution holds the same probability for the entire interval. Thus, its plot is a rectangle, and therefore it is often referred to as Rectangular distribution. Here we will discuss various functions and cases in which these functions should be used to get a required probability.
For uniform distribution, we first need a randomly created sequence ranging between two numbers. The runif() function in R programming language is used to generate a sequence of random following the uniform distribution.
Syntax:
runif(n, min = 0, max = 1)
Parameter:
- n= number of random samples
- min=minimum value(by default 0)
- max=maximum value(by default 1)
Example:
R
print("Random 15 numbers between 1 and 3")
runif(15, min=1, max=3)
|
Output
[1] “Random 15 numbers between 1 and 3”
[1] 1.534 1.772 1.027 1.765 2.739 1.681 1.964 2.199 1.987 1.372 2.655 2.337 2.588 1.216 2.447
Quantile for a probability
By a quantile, we mean the fraction (or percent) of points below the given value. qunif() method is used to calculate the corresponding quantile for any probability (p) for a given uniform distribution. To use this simply the function had to be called with the required parameters.
Syntax:
qunif(p, min = 0, max = 1)
Parameter :
- p – The vector of probabilities
- min , max – The limits for calculation of quantile function
Example 1:
R
min <- 0
max <- 40
print ("Quantile Function Value")
qunif(0.2, min = min, max = max)
|
Output
[1] “Quantile Function Value”
[1] 8
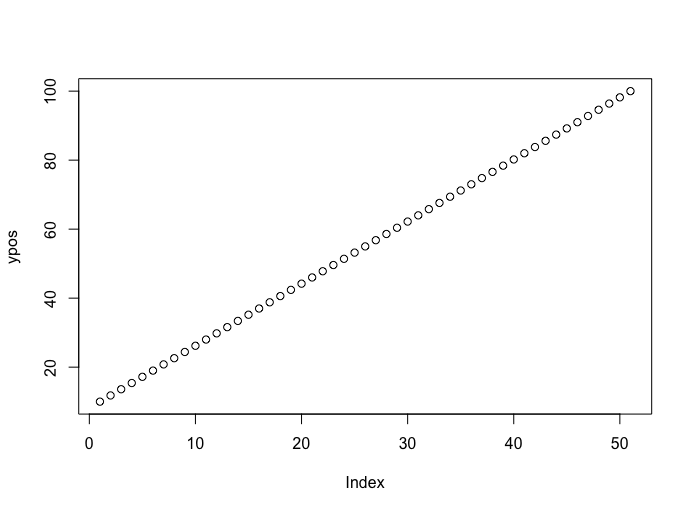
The x values can be specified in the form of a sequence of vectors using the seq() method in R. The corresponding y positions can be calculated.
Example 2:
R
min <- 0
max <- 1
xpos <- seq(min, max , by = 0.02)
ypos <- qunif(xpos, min = 10, max = 100)
plot(ypos)
|
Output
Probability Density Function
dunif() method in R programming language is used to generate density function. It calculates the uniform density function in R language in the specified interval (a, b).
Syntax:
dunif(x, min = 0, max = 1, log = FALSE)
Parameter:
- x: input sequence
- min, max= range of values
- log: indicator, of whether to display the output values as probabilities.
The result produced will be for each value of the interval. Hence, a sequence will be generated.
Example 1:
R
x <- 5:10
print ("dunif value")
dunif(x, min = 1, max = 20)
|
Output
[1] “dunif value”
[1] 0.05263158 0.05263158 0.05263158 0.05263158 0.05263158 0.05263158
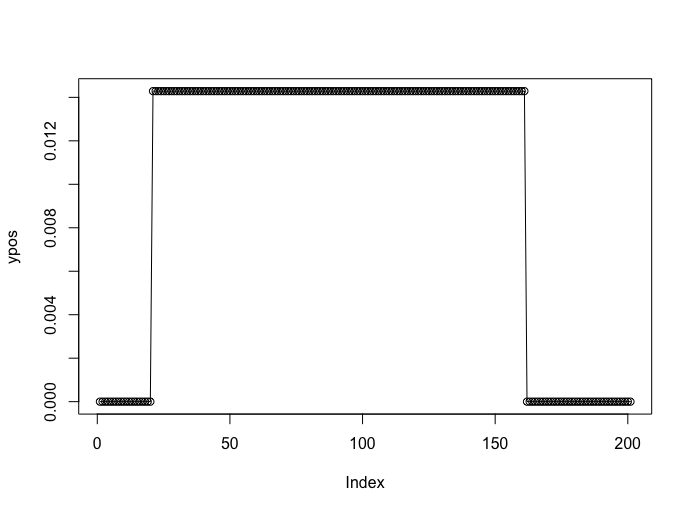
All values are equal and this is the reason why it is called uniform distribution. Let us plot it for a better picture.
Example 2:
R
min <- 0
max <- 100
xpos <- seq(min, max , by = 0.5)
ypos <- dunif(xpos, min = 10, max = 80)
plot(ypos , type="o")
|
Output
Cumulative probability distribution
The punif() method in R is used to calculate the uniform cumulative distribution function, this is, the probability of a variable X taking a value lower than x (that is, x <= X). If we need to compute a value x > X, we can calculate 1 – punif(x).
Syntax:
punif(q, min = 0, max = 1, lower.tail = TRUE)
All the independent probabilities that satisfy the comparison condition will be added.
Example:
R
min <- 0
max <- 60
punif (15 , min =min , max = max)
|
Output
[1] 0.25
Example:
R
min <- 0
max <- 60
punif (15 , min =min , max = max, lower.tail=FALSE)
|
Output
[1] 0.75
Share your thoughts in the comments
Please Login to comment...