Grouping Data with ROLLUP in PostgreSQL
Last Updated :
24 Apr, 2024
In database management, reducing and compressing data is one of the most significant jobs. PostgreSQL, which is an open-source, stable relational database management system, boosts many features that are meant to help in this regard.
Another element is ROLLUP which maintains the hierarchical data aggregation needed to yield insightful summaries of the dataset. This article is about the details of the application ROLLUP in PostgreSQL for grouping data.
What is ROLLUP?
ROLLUP is the extension of the GROUP BY function in SQL that supports multi-dimensional aggregation. It sums up the subtotals for a particular set of columns and thus determines the order in which the columns appear.
Syntax:
The syntax for using ROLLUP in PostgreSQL is as follows:
SELECT column1, column2, ..., aggregate_function(column)
FROM table_name
GROUP BY ROLLUP(column1, column2, ...);
Here, column1, column2, etc., represent the columns used for grouping, and aggregate_function denotes the function applied to compute the aggregate values.
Example of Grouping Data with ROLLUP
Let’s create a table named sales data and then insert some data into after that we will perform some query operations of grouping data with ROLLUP.
Create the table
CREATE TABLE sales (
    region VARCHAR(50),
    product VARCHAR(50),
    sales_amount NUMERIC
);
Insert some sample data
INSERT INTO sales_data (region, product, sales_amount) VALUES
('North', 'Product A', 100),
('North', 'Product B', 150),
('South', 'Product A', 120),
('South', 'Product B', 180),
('East', 'Product A', 90),
('East', 'Product B', 130),
('West', 'Product A', 110),
('West', 'Product B', 160);
Output:
You can see the table content below:
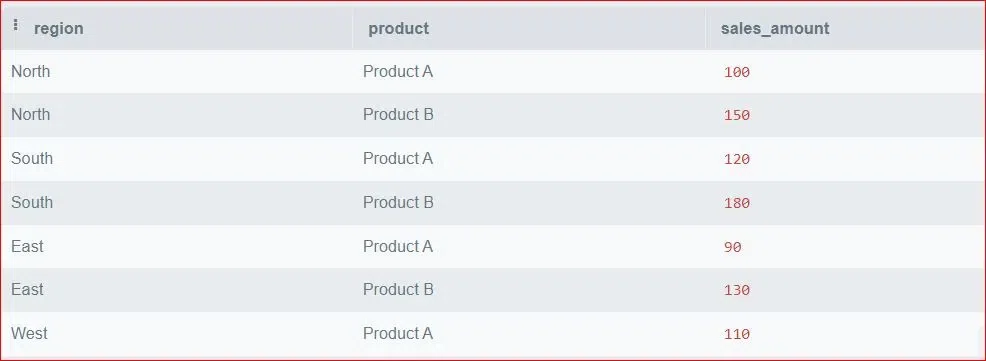
Sales Data Table
Example 1 – Grouping by region and product with ROLLUP
Query:
SELECT region, product, SUM(sales_amount) AS total_sales
FROM sales_data
GROUP BY ROLLUP(region, product);
Explanation:
- SELECT region, product, SUM(sales_amount) AS total_sales: It selects the region, product, and sum(sales_amount) which were from the sales_data table that was denoted as total_sales.
- GROUP BY ROLLUP: This statement applies the data to the columns (region and product) and sums up the rows for each of the combination of these columns. With the help of the ROLLUP function subtotals will be generated for the different level of aggregation e.g. at the product level and the product and region level.
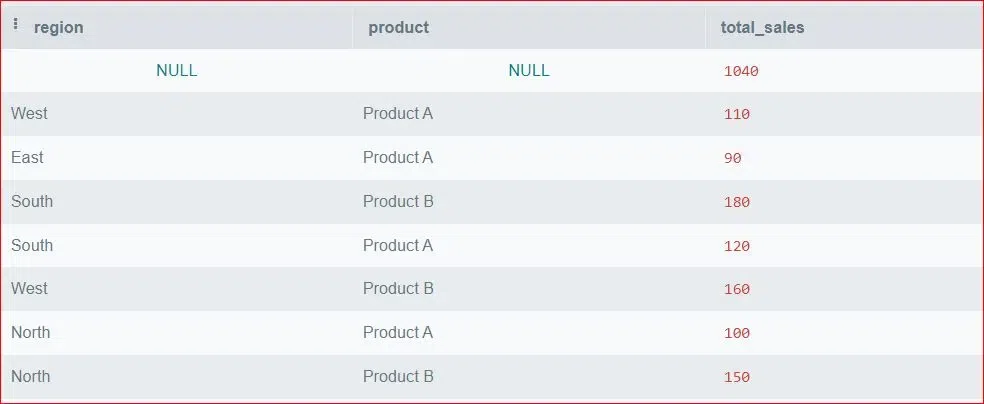
Output:
The output would be a total of sales each product by region, sales standing of each region and total sales.

Grouping by region and product
Example 2 – Grouping by Region with Subtotals
Query:
SELECT region, SUM(sales_amount) AS total_sales
FROM sales_data
GROUP BY ROLLUP(region);
Explanation:
- SELECT region, SUM(sales_amount) AS total_sales: It picks up two columns region and sum of sales_amount from the sales_data table which is aliased as total_sales.
- GROUP BY ROLLUP(region): It does group the data on the basis of the region column and sums up the subtotals as per the aggregation of the ROLLUP function. In this case, it will generate subtotals for each level of region, including the grand total.
Output:
The output will show the total sales for each individual region, subtotals for combinations of regions, and the overall total sales.

Grouping by Region
Example 3 – Grouping by Product with Subtotals
SELECT product, SUM(sales_amount) AS total_sales
FROM sales_data
GROUP BY ROLLUP(product);
Explanation:
- SELECT product, SUM(sales_amount) AS total_sales: There are two columns named product and the subtotal of sales_amount. They are named as total_sales which comes from the sales_data table.
- GROUP BY ROLLUP(product): This aggregates the data according to the product column, and subsequently, it computes subtotals for each layer of aggregation declared by the ROLLUP function. Thus, at each product level, it will show subtotals and the overall total.
Output:
The output will demonstrate the total sales figure for each product alone, find the subtotals for a combination of products, and provide the overall total sales.
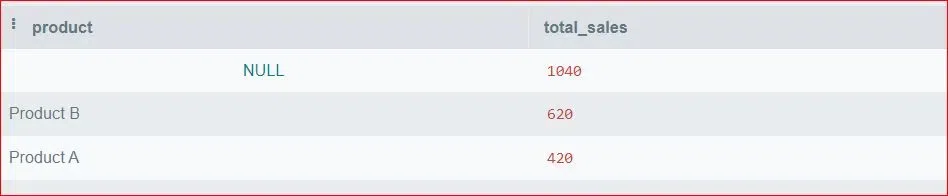
Grouping by Product
Example 4 – Grouping by Region and Product Category with Subtotals
Query:
SELECT region, product, SUM(sales_amount) AS total_sales
FROM sales_data
GROUP BY ROLLUP(region, product);
Explanation:
- SELECT region, product, SUM(sales_amount) AS total_sales: It chooses three columns region, product, and total_sales which is an alias for the sale_data table.
- GROUP BY ROLLUP(region, product): It groups the data under both region and product columns and returns sub totals determined by the ROLLUP function. In this instance, it will obtain subtotals for each region and product grouping, as well as subtotals for each region and the grand total.
Output:
These results will be displayed as the sum of sales for different regions and products, the regions subtotals, as well as the grand total of sales.
Grouping by Region and Product
Conclusion
ROLLUP in PostgreSQL is a valuable feature for grouping and summarizing data hierarchically. By leveraging its capabilities, users can efficiently generate insightful summary reports with minimal effort. Understanding its syntax, interpreting results, and considering its limitations are crucial for harnessing the full potential of ROLLUP in PostgreSQL-based database environments. Mastering ROLLUP empowers database professionals to perform comprehensive data analysis and derive meaningful insights from their datasets.
Share your thoughts in the comments
Please Login to comment...