How to find Definite Integral using Python ?
Last Updated :
15 Mar, 2021
Definite integrals are the extension after indefinite integrals, definite integrals have limits [a, b]. It gives the area of a curve bounded between given limits.

It denotes the area of curve F(x) bounded between a and b, where a is the lower limit and b is the upper limit.
In this article, we will discuss how we can solve definite integrals in python, and would also visualize the area between them using matplotlib. We would also use the NumPy module for defining the range of the variable we are integrating. Let’s Begin with installing the modules.
Module needed:
- matplotlib: We would use this to visualize our area under the graph formed by a definite integral.
- numpy: Helper library to define ranges of definite integrals.
- sympy: Library to calculate the numerical solution of the integral easily.
Approach
For calculating area under curve
- Import module
- Declare function
- Integrate.
Syntax :
sympy.integrate(expression, reference variable)
For plotting
- Import module
- Define a function
- Define a variable
- Draw the curve
- Fill the color under it using some condition.
- Display plot
Given below is the implementation for the same.
The area between a curve and standard axis
Example 1 :
Python
import matplotlib.pyplot as plt
import numpy as np
import sympy as sy
def f(x):
return x**2
x = sy.Symbol("x")
print(sy.integrate(f(x), (x, 0, 2)))
|
Output:
8/3
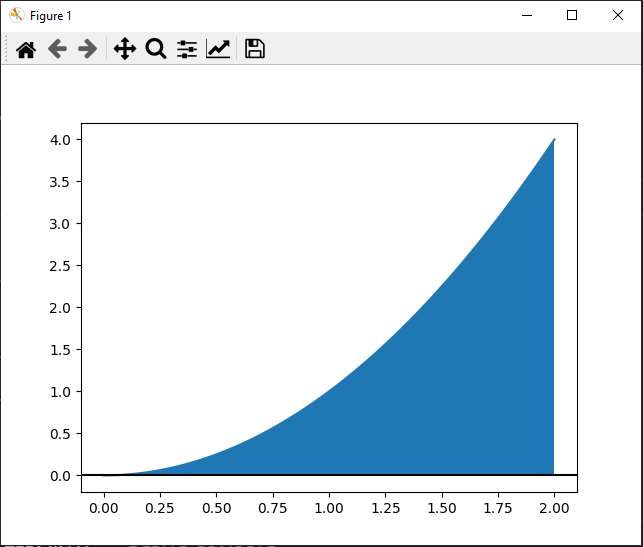
Example 2:
Python3
import matplotlib.pyplot as plt
import numpy as np
def f(x):
return x**2
x = np.linspace(0, 2, 1000)
plt.plot(x, f(x))
plt.axhline(color="black")
plt.fill_between(x, f(x), where=[(x > 0) and (x < 2) for x in x])
plt.show()
|
Output:
The area between two curves
Example 1:
Python3
import matplotlib.pyplot as plt
import numpy as np
import sympy as sy
def f(x):
return x**2
def g(x):
return x**(1/2)
x = sy.Symbol("x")
print(sy.integrate(f(x)-g(x), (x, 0, 2)))
|
Output:
0.781048583502540
Example 2:
Python3
import matplotlib.pyplot as plt
import numpy as np
def f(x):
return x**2
def g(x):
return x**(1/2)
x = np.linspace(0, 2, 1000)
plt.plot(x, f(x))
plt.plot(x, g(x))
plt.fill_between(x, f(x), g(x), where=[(x > 0) and (x < 2) for x in x])
plt.show()
|
Output:

Share your thoughts in the comments
Please Login to comment...