How to Make a Bell Curve in R?
Last Updated :
24 Feb, 2021
To make a bell curve in R we will be using the help of normal distribution which will lead to a bell curve that will be symmetrical about the mean. Half of the data will fall to the left of the mean and half will fall to the right.
In probability theory, a normal distribution is a type of continuous probability distribution for a real-valued random variable.
Mathematical formula:

Where,
 is mean
 is standard deviation.
For the normal distribution, we use dnorm() function to get the value of the probability density function for the normal distribution given parameters for x, μ, and σ.
Syntax: dnorm(x, mean, sd) (sd=Standard Deviation)
Parameters:-
- X is a vector of numbers.
- Mean is the mean value of the sample data. Its default value is zero.
- Sd is the standard deviation. Its default value is 1.
Returns:-The probability distribution at each point for a given mean and standard deviation.
Approach
- Create a sequence of numbers
- Get probability distribution at each point for a given mean and standard deviation
- Plot data with appropriate attributes
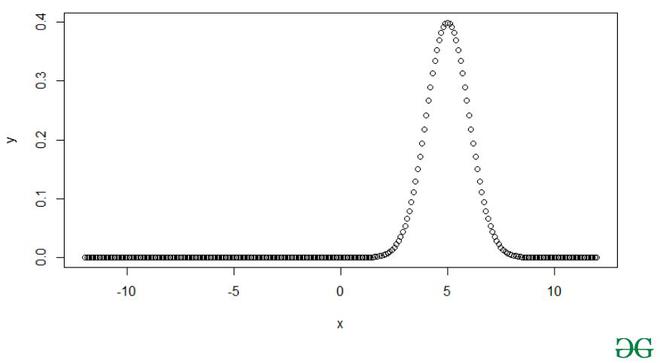
Example 1:
R
x <- seq(-12, 12, by = .1)
y <- dnorm(x, mean = 5, sd = 1)
plot(x,y)
|
Output:
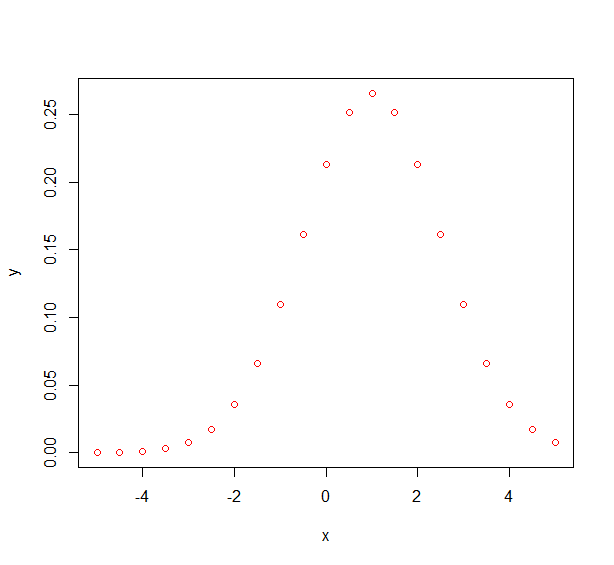
Example 2:
R
x <- seq(-5, 5, by = .5)
y <- dnorm(x, mean = 1, sd = 1.5)
plot(x,y, col="red")
|
Output:
Share your thoughts in the comments
Please Login to comment...