How to Normalize and Standardize Data in R?
Last Updated :
14 Jan, 2022
In this article, we will be looking at the various techniques to scale data, Min-Max Normalization, Z-Score Standardization, and Log Transformation in the R programming language.
Loading required packages and dataset:
Let’s install and load the required packages. And also create a dataframe as a sample dataset.
R
install.packages("caret")
library(caret)
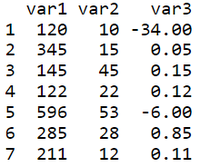
data = data.frame(var1=c(120, 345, 145, 122, 596, 285, 211),
var2=c(10, 15, 45, 22, 53, 28, 12),
var3=c(-34, 0.05, 0.15, 0.12, -6, 0.85, 0.11))
data
|
Output:
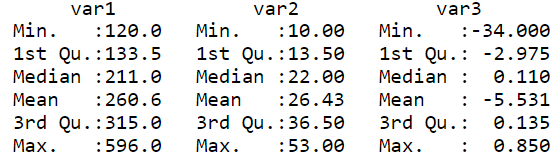
Summary of Data:
Let’s check out the summary of the data before scaling it. As we can see from the output, each variable/feature has a different range of values (which can be inferred from min and max values) and thus need scaling to bring the values within a fixed range.
R
library(caret)
data = data.frame(var1 = c(120,345,145,122,596,285,211),
var2 = c(10,15,45,22,53,28,12),
var3 = c(-34,0.05,0.15,0.12,-6,0.85,0.11))
summary(data)
|
Output:
Normalization:
Method 1: Min-Max Normalization
This technique rescales values to be in the range between 0 and 1. Also, the data ends up with smaller standard deviations, which can suppress the effect of outliers.
Example: Let’s write a custom function to implement Min-Max Normalization.

Min-Max Normalization
This is the formula for Min-Max Normalization. Let’s use this formula and create a custom user-defined function, minMax which takes in one value at a time and computes the scaled value such that it lies between 0 and 1. Here new_max(A) is 1 and new_min(A) is 0 as we trying in scale down/up the values in the range [0,1].
This helps in handling the outliers well and suppresses them overall.
R
library(caret)
data = data.frame(var1 = c(120,345,145,122,596,285,211),
var2 = c(10,15,45,22,53,28,12),
var3 = c(-34,0.05,0.15,0.12,-6,0.85,0.11))
minMax <- function(x) {
(x - min(x)) / (max(x) - min(x))
}
normalisedMydata <- as.data.frame(lapply(data, minMax))
head(normalisedMydata)
|
Output:
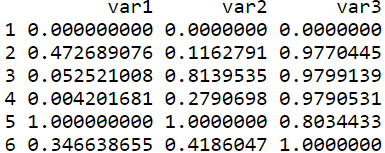
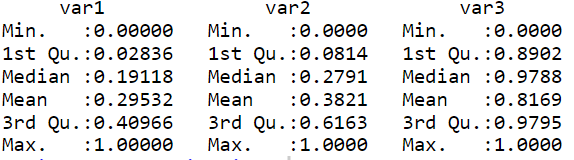
Let’s now check if the values of the 4 columns are rescaled between 0 and 1 using a summary of the data (min and max are 0 and 1 respectively).
R
summary(normalisedMydata)
|
Output:
Example: Using an in-built function and caret package to perform Min-Max Normalization
Here the method, preProcess( ) takes a tuple with value “range” to implement min-max scaling and this preprocessed data is sent to predict( ) function to get the final normalized data using the min-max scaling method.
Syntax:
preProcess(x, method = c(“center”, “scale”), … na.remove = TRUE )
Arguments:
- x – a matrix or data frame
- method – a character vector specifying the type of processing
- na.remove – true/false to specify removal of missing values
R
library(caret)
data = data.frame(var1 = c(120,345,145,122,596,285,211),
var2 = c(10,15,45,22,53,28,12),
var3 = c(-34,0.05,0.15,0.12,-6,0.85,0.11))
preproc <- preProcess(mydata, method=c("range"))
norm <- predict(preproc, mydata)
head(norm)
|
Output:
This technique tends to center the rescaled data around the mean, but it doesn’t handle outliers very well. So to tackle this we go for standardization.
Method 2: Log Transformation
Not all real-life data would follow a gaussian distribution nor would be less skewed. So to tackle this Log Transformation technique can be used.
Example: Using log( ) function
Let’s log transform a particular column var2 in data and view it’s summary.
Syntax:
log(x, base = exp(1))
Arguments:
- x – a numeric or complex vector
- base – a positive or complex number
Log( ) function takes in numeric vector or complex vector of the data and performs log transformation.
R
library(caret)
data = data.frame(var1 = c(120,345,145,122,596,285,211),
var2 = c(10,15,45,22,53,28,12),
var3 = c(-34,0.05,0.15,0.12,-6,0.85,0.11))
logTransformed = log(mydata$var2)
logTransformed
|
Output:

Log Transformation
Standardization:
Standardization is a technique in which all the features have a mean around zero and have roughly unit variance (mean = 0 and standard deviation = 1). And also makes sure that outliers get weighted more than other values.
Example : Using Standard scale( ) function
Function:
scale(x, center = TRUE, scale = TRUE)
Arguments:
- x – a numeric matrix(like object)
- center – either a logical value or numeric-alike vector of length equal to the number of columns of x
- scale – either a logical value or a numeric-alike vector of length equal to the number of columns of x
scale( ) function (a part of caret package in R) takes in a matrix or dataframe object and scales the data points such that the mean and standard deviation is 0 and 1 respectively.
R
library(caret)
data = data.frame(var1 = c(120,345,145,122,596,285,211),
var2 = c(10,15,45,22,53,28,12),
var3 = c(-34,0.05,0.15,0.12,-6,0.85,0.11))
standardizedData <- as.data.frame(scale(data))
head(standardizedData)
|
Output:
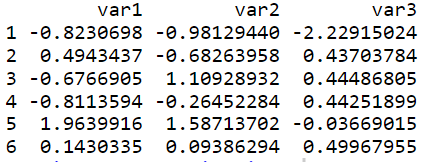
Example: Using an in-built function in the caret library to preprocess and then standardize the data.
Here the method, preProcess( ) will take a tuple with values “center” and “scale” to implement standardization. This preprocessed data is sent to predict( ) to standardize the data such that the mean is 0 and the standard deviation is 1.
R
library(caret)
data = data.frame(var1 = c(120,345,145,122,596,285,211),
var2 = c(10,15,45,22,53,28,12),
var3 = c(-34,0.05,0.15,0.12,-6,0.85,0.11))
preproc1 <- preProcess(data, method=c("center", "scale"))
norm1 <- predict(preproc1,data)
head(norm1)
|
Output:
Share your thoughts in the comments
Please Login to comment...