Matplotlib is a library in Python and it is numerical – mathematical extension for NumPy library. The Artist class contains Abstract base class for objects that render into a FigureCanvas. All visible elements in a figure are subclasses of Artist.
Matplotlib.artist.Artist.findobj() Method
The findobj() method in artist module of matplotlib library is used to return find artist objects.
Syntax: Artist.findobj(self, match=None, include_self=True)
Parameters: This method accepts the following parameters.
- match : This parameter is the filter criterion for the matches. It default value is None.
- include_self : This parameter include self in the list to be checked for a match.
Returns: This method return artists(list of Artist).
Below examples illustrate the matplotlib.artist.Artist.findobj() function in matplotlib:
Example 1:
from matplotlib.artist import Artist
import matplotlib.pyplot as plt
from matplotlib.lines import Line2D
import numpy as np
from numpy.random import rand
fig, ax2 = plt.subplots()
ax2.bar(range(10), rand(10), picker = True)
print("Value return : \n",
*list(Artist.findobj(ax2)), sep ="\n")
plt.title(
, fontweight="bold")
plt.show()
|
Output:
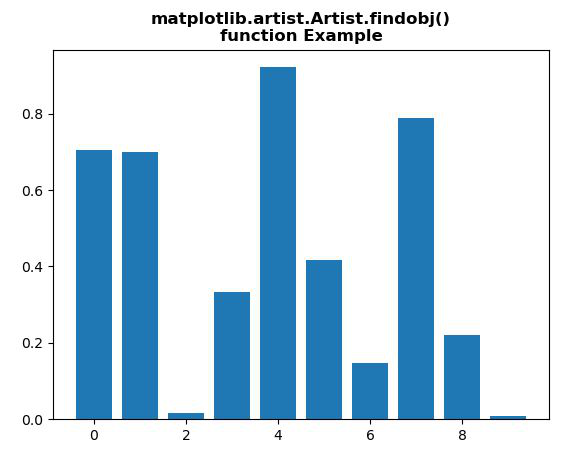
Value return :

Rectangle(xy=(-0.4, 0), width=0.8, height=0.705031, angle=0)
Rectangle(xy=(0.6, 0), width=0.8, height=0.698788, angle=0)
Rectangle(xy=(1.6, 0), width=0.8, height=0.0159568, angle=0)
Rectangle(xy=(2.6, 0), width=0.8, height=0.332931, angle=0)
Rectangle(xy=(3.6, 0), width=0.8, height=0.921611, angle=0)
Rectangle(xy=(4.6, 0), width=0.8, height=0.4171, angle=0)
Rectangle(xy=(5.6, 0), width=0.8, height=0.148145, angle=0)
Rectangle(xy=(6.6, 0), width=0.8, height=0.78801, angle=0)
Rectangle(xy=(7.6, 0), width=0.8, height=0.221423, angle=0)
Rectangle(xy=(8.6, 0), width=0.8, height=0.00829394, angle=0)
Spine
Spine
Spine
Spine
Text(0.5, 0, '')
Text(1, 0, '')
Line2D()
Line2D()
Line2D((0,0),(0,1))
Text(0, 0, '')
Text(0, 1, '')
<matplotlib.axis.XTick object at 0x07BE51D0>
Line2D()
Line2D()
Line2D((0,0),(0,1))
Text(0, 0, '')
Text(0, 1, '')
<matplotlib.axis.XTick object at 0x07BE51B0>
Line2D()
Line2D()
Line2D((0,0),(0,1))
Text(0, 0, '')
Text(0, 1, '')
<matplotlib.axis.XTick object at 0x0A589750>
Line2D()
Line2D()
Line2D((0,0),(0,1))
Text(0, 0, '')
Text(0, 1, '')
<matplotlib.axis.XTick object at 0x0A5A1C50>
Line2D()
Line2D()
Line2D((0,0),(0,1))
Text(0, 0, '')
Text(0, 1, '')
<matplotlib.axis.XTick object at 0x0A5A1B70>
Line2D()
Line2D()
Line2D((0,0),(0,1))
Text(0, 0, '')
Text(0, 1, '')
<matplotlib.axis.XTick object at 0x0A5B4170>
Line2D()
Line2D()
Line2D((0,0),(0,1))
Text(0, 0, '')
Text(0, 1, '')
<matplotlib.axis.XTick object at 0x0A5B4430>
XAxis(80.0,52.8)
Text(0, 0.5, '')
Text(0, 0.5, '')
Line2D()
Line2D()
Line2D((0,0),(1,0))
Text(0, 0, '')
Text(1, 0, '')
<matplotlib.axis.YTick object at 0x07BE58F0>
Line2D()
Line2D()
Line2D((0,0),(1,0))
Text(0, 0, '')
Text(1, 0, '')
<matplotlib.axis.YTick object at 0x07BE5570>
Line2D()
Line2D()
Line2D((0,0),(1,0))
Text(0, 0, '')
Text(1, 0, '')
<matplotlib.axis.YTick object at 0x0A5B4670>
Line2D()
Line2D()
Line2D((0,0),(1,0))
Text(0, 0, '')
Text(1, 0, '')
<matplotlib.axis.YTick object at 0x0A5B4AB0>
Line2D()
Line2D()
Line2D((0,0),(1,0))
Text(0, 0, '')
Text(1, 0, '')
<matplotlib.axis.YTick object at 0x0A5B4D90>
Line2D()
Line2D()
Line2D((0,0),(1,0))
Text(0, 0, '')
Text(1, 0, '')
<matplotlib.axis.YTick object at 0x0A5BE0F0>
YAxis(80.0,52.8)
Text(0.5, 1.0, '')
Text(0.0, 1.0, '')
Text(1.0, 1.0, '')
Rectangle(xy=(0, 0), width=1, height=1, angle=0)
AxesSubplot(0.125,0.11;0.775x0.77)
Example 2:
from matplotlib.artist import Artist
import numpy as np
import matplotlib.pyplot as plt
import matplotlib.patches as mpatches
fig, ax = plt.subplots()
x, y = 10 * np.random.rand(2, 1000)
ax.plot(x, y, 'go', alpha = 0.2)
circ = mpatches.Circle((0.5, 0.5), 0.25,
transform = ax.transAxes,
facecolor ='blue',
alpha = 0.75)
ax.add_patch(circ)
print("Value return : \n",
*list(Artist.findobj(ax)), sep ="\n")
plt.title(
, fontweight="bold")
plt.show()
|
Output:
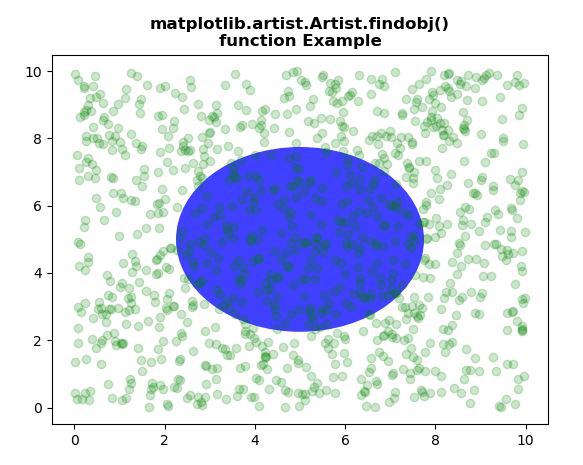
Value return :

Circle(xy=(0.5, 0.5), radius=0.25)
Line2D(_line0)
Spine
Spine
Spine
Spine
Text(0.5, 0, '')
Text(1, 0, '')
Line2D()
Line2D()
Line2D((0,0),(0,1))
Text(0, 0, '')
Text(0, 1, '')
<matplotlib.axis.XTick object at 0x085071F0>
Line2D()
Line2D()
Line2D((0,0),(0,1))
Text(0, 0, '')
Text(0, 1, '')
<matplotlib.axis.XTick object at 0x085071D0>
Line2D()
Line2D()
Line2D((0,0),(0,1))
Text(0, 0, '')
Text(0, 1, '')
<matplotlib.axis.XTick object at 0x0AE7ABF0>
Line2D()
Line2D()
Line2D((0,0),(0,1))
Text(0, 0, '')
Text(0, 1, '')
<matplotlib.axis.XTick object at 0x0AE7AD70>
Line2D()
Line2D()
Line2D((0,0),(0,1))
Text(0, 0, '')
Text(0, 1, '')
<matplotlib.axis.XTick object at 0x0AE920F0>
Line2D()
Line2D()
Line2D((0,0),(0,1))
Text(0, 0, '')
Text(0, 1, '')
<matplotlib.axis.XTick object at 0x0AE92390>
Line2D()
Line2D()
Line2D((0,0),(0,1))
Text(0, 0, '')
Text(0, 1, '')
<matplotlib.axis.XTick object at 0x0AE92650>
Line2D()
Line2D()
Line2D((0,0),(0,1))
Text(0, 0, '')
Text(0, 1, '')
<matplotlib.axis.XTick object at 0x0AE928F0>
XAxis(80.0,52.8)
Text(0, 0.5, '')
Text(0, 0.5, '')
Line2D()
Line2D()
Line2D((0,0),(1,0))
Text(0, 0, '')
Text(1, 0, '')
<matplotlib.axis.YTick object at 0x08507910>
Line2D()
Line2D()
Line2D((0,0),(1,0))
Text(0, 0, '')
Text(1, 0, '')
<matplotlib.axis.YTick object at 0x08507590>
Line2D()
Line2D()
Line2D((0,0),(1,0))
Text(0, 0, '')
Text(1, 0, '')
<matplotlib.axis.YTick object at 0x0AE92A90>
Line2D()
Line2D()
Line2D((0,0),(1,0))
Text(0, 0, '')
Text(1, 0, '')
<matplotlib.axis.YTick object at 0x0AE92DB0>
Line2D()
Line2D()
Line2D((0,0),(1,0))
Text(0, 0, '')
Text(1, 0, '')
<matplotlib.axis.YTick object at 0x0AE92FF0>
Line2D()
Line2D()
Line2D((0,0),(1,0))
Text(0, 0, '')
Text(1, 0, '')
<matplotlib.axis.YTick object at 0x0AE92B10>
Line2D()
Line2D()
Line2D((0,0),(1,0))
Text(0, 0, '')
Text(1, 0, '')
<matplotlib.axis.YTick object at 0x0AE7AC50>
Line2D()
Line2D()
Line2D((0,0),(1,0))
Text(0, 0, '')
Text(1, 0, '')
<matplotlib.axis.YTick object at 0x0AEA00F0>
YAxis(80.0,52.8)
Text(0.5, 1.0, '')
Text(0.0, 1.0, '')
Text(1.0, 1.0, '')
Rectangle(xy=(0, 0), width=1, height=1, angle=0)
AxesSubplot(0.125,0.11;0.775x0.77)
Share your thoughts in the comments
Please Login to comment...