Matplotlib.axes.Axes.minorticks_on() in Python
Last Updated :
21 Apr, 2020
Matplotlib is a library in Python and it is numerical – mathematical extension for NumPy library. The Axes Class contains most of the figure elements: Axis, Tick, Line2D, Text, Polygon, etc., and sets the coordinate system. And the instances of Axes supports callbacks through a callbacks attribute.
matplotlib.axes.Axes.minorticks_on() Function
The Axes.minorticks_on() function in axes module of matplotlib library is used to display minor ticks on the axes.
Syntax:
Axes.minorticks_on(self)
Below examples illustrate the matplotlib.axes.Axes.minorticks_on() function in matplotlib.axes:
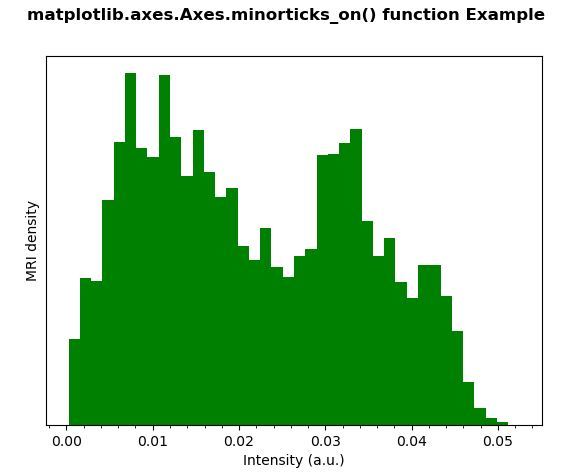
Example 1:
import numpy as np
import matplotlib.pyplot as plt
import matplotlib.cbook as cbook
import matplotlib.cm as cm
from matplotlib.collections import LineCollection
from matplotlib.ticker import MultipleLocator
with cbook.get_sample_data('s1045.ima.gz') as dfile:
im = np.frombuffer(dfile.read(),
np.uint16).reshape((256, 256))
fig, ax1 = plt.subplots()
im = np.ravel(im)
im = im[np.nonzero(im)]
im = im / (2**20 - 1)
ax1.hist(im, bins = 40, color ="green")
ax1.set_yticks([])
ax1.set_xlabel('Intensity (a.u.)')
ax1.set_ylabel('MRI density')
ax1.minorticks_on()
fig.suptitle('matplotlib.axes.Axes.minorticks_on() \
function Example\n\n', fontweight ="bold")
plt.show()
|
Output:
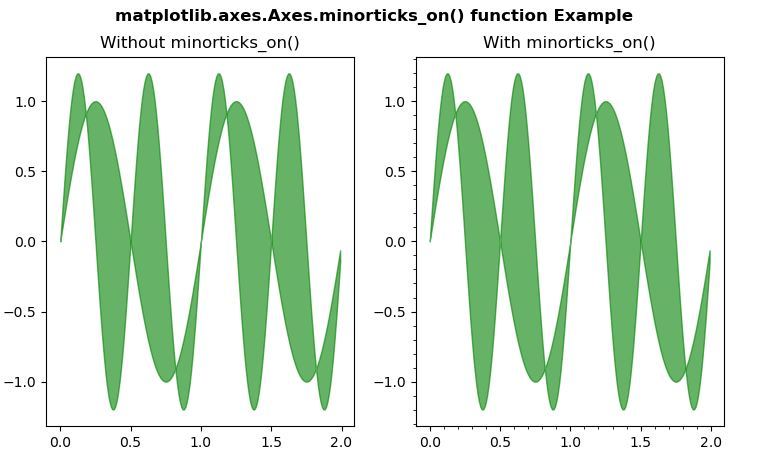
Example 2:
import matplotlib.pyplot as plt
import numpy as np
x = np.arange(0.0, 2, 0.01)
y1 = np.sin(2 * np.pi * x)
y2 = 1.2 * np.sin(4 * np.pi * x)
fig, (ax, ax1) = plt.subplots(1, 2)
ax.fill_between(x, y1, y2, color ="green",
alpha = 0.6)
ax.set_title("Without minorticks_on()")
ax1.fill_between(x, y1, y2, color ="green",
alpha = 0.6)
ax1.minorticks_on()
ax1.set_title("With minorticks_on()")
fig.suptitle('matplotlib.axes.Axes.minorticks_on()\
function Example\n\n', fontweight ="bold")
plt.show()
|
Output:
Share your thoughts in the comments
Please Login to comment...