Matplotlib.axes.Axes.set_transform() in Python
Last Updated :
30 Apr, 2020
Matplotlib is a library in Python and it is numerical – mathematical extension for NumPy library. The Axes Class contains most of the figure elements: Axis, Tick, Line2D, Text, Polygon, etc., and sets the coordinate system. And the instances of Axes supports callbacks through a callbacks attribute.
matplotlib.axes.Axes.set_transform() Function
The Axes.set_transform() function in axes module of matplotlib library is used to set the artist transform.
Syntax: Axes.set_transform(self, t)
Parameters: This method accepts only one parameters.
- t : This parameter is the Transform.
Returns: This method does not return any value.
Below examples illustrate the matplotlib.axes.Axes.set_transform() function in matplotlib.axes:
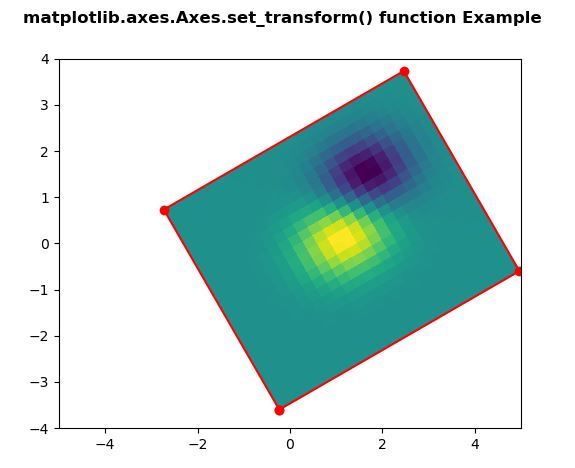
Example 1:
import numpy as np
import matplotlib.pyplot as plt
import matplotlib.transforms as mtransforms
delta = 0.25
x = y = np.arange(-3.0, 3.0, delta)
X, Y = np.meshgrid(x, y)
Z1 = np.exp(-X**2 - Y**2)
Z2 = np.exp(-(X - 1)**2 - (Y - 1)**2)
Z = (Z1 - Z2)
transform = mtransforms.Affine2D().rotate_deg(30)
fig, ax = plt.subplots()
im = ax.imshow(Z, interpolation ='none',
origin ='lower',
extent =[-2, 4, -3, 2],
clip_on = True)
trans_data = transform + ax.transData
im.set_transform(trans_data)
x1, x2, y1, y2 = im.get_extent()
ax.plot([x1, x2, x2, x1, x1],
[y1, y1, y2, y2, y1],
"ro-",
transform = trans_data)
ax.set_xlim(-5, 5)
ax.set_ylim(-4, 4)
fig.suptitle('matplotlib.axes.Axes.set_transform() \
function Example\n\n', fontweight ="bold")
plt.show()
|
Output:
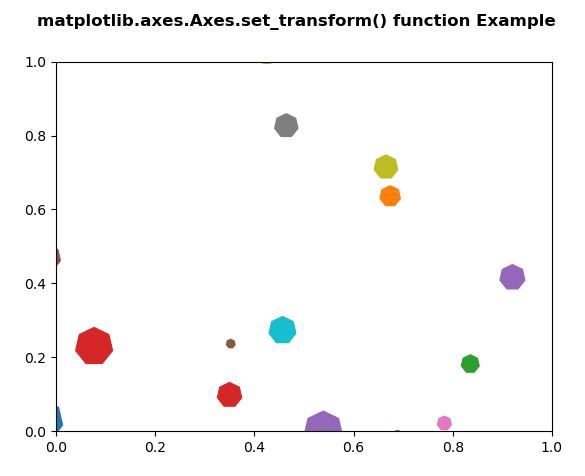
Example 2:
import matplotlib.pyplot as plt
from matplotlib import collections, colors, transforms
import numpy as np
nverts = 50
npts = 100
r = np.arange(nverts)
theta = np.linspace(0, 2 * np.pi, nverts)
xx = r * np.sin(theta)
yy = r * np.cos(theta)
spiral = np.column_stack([xx, yy])
rs = np.random.RandomState(19680801)
xyo = rs.randn(npts, 2)
colors = [colors.to_rgba(c)
for c in plt.rcParams['axes.prop_cycle'].by_key()['color']]
fig, ax1 = plt.subplots()
col = collections.RegularPolyCollection(
7, sizes = np.abs(xx) * 10.0,
offsets = xyo,
transOffset = ax1.transData)
trans = transforms.Affine2D().scale(fig.dpi / 72.0)
col.set_transform(trans)
ax1.add_collection(col, autolim = True)
col.set_color(colors)
fig.suptitle('matplotlib.axes.Axes.set_transform() function\
Example\n', fontweight ="bold")
fig.canvas.draw()
plt.show()
|
Output:
Share your thoughts in the comments
Please Login to comment...