Python | Pandas Series.kurt()
Last Updated :
12 Feb, 2019
Pandas series is a One-dimensional ndarray with axis labels. The labels need not be unique but must be a hashable type. The object supports both integer- and label-based indexing and provides a host of methods for performing operations involving the index.
Pandas Series.kurt() function return unbiased kurtosis over requested axis using Fisher’s definition of kurtosis (kurtosis of normal == 0.0). The result is normalized by N-1.
Syntax: Series.kurt(axis=None, skipna=None, level=None, numeric_only=None, **kwargs)
Parameter :
axis : Axis for the function to be applied on.
skipna : Exclude NA/null values when computing the result.
level : If the axis is a MultiIndex (hierarchical), count along a particular level, collapsing into a scalar.
numeric_only : Include only float, int, boolean columns.
**kwargs : Additional keyword arguments to be passed to the function.
Returns : kurt : scalar or Series (if level specified)
Example #1: Use Series.kurt() function to find the kurtosis of the underlying data of the given series object.
import pandas as pd
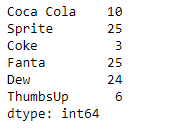
sr = pd.Series([10, 25, 3, 25, 24, 6])
index_ = ['Coca Cola', 'Sprite', 'Coke', 'Fanta', 'Dew', 'ThumbsUp']
sr.index = index_
print(sr)
|
Output :
Now we will use Series.kurt() function to find the kurtosis of the underlying data of the given series object.
result = sr.kurt()
print(result)
|
Output :

As we can see in the output, the Series.kurt() function has returned the kurtosis of the given series object.
Example #2 : Use Series.kurt() function to find the kurtosis of the underlying data of the given series object.
import pandas as pd
sr = pd.Series([11, 21, 8, 18, 65, 84, 32, 10, 5, 24, 32])
index_ = pd.date_range('2010-10-09', periods = 11, freq ='M')
sr.index = index_
print(sr)
|
Output :

Now we will use Series.kurt() function to find the kurtosis of the underlying data of the given series object.
result = sr.kurt()
print(result)
|
Output :

As we can see in the output, the Series.kurt() function has returned the kurtosis of the given series object.
Share your thoughts in the comments
Please Login to comment...