Solve Differential Equations with ODEINT Function of SciPy module in Python
Last Updated :
09 Oct, 2022
In this post, we are going to learn how to solve differential equations with odeint function of scipy module in Python.
ODE stands for Ordinary Differential Equation and refers to those kinds of differential equations that involve derivatives but no partial derivatives. In other words, we only consider one independent variable in these equations.
So, in this article we have used scipy, NumPy, and Matplotlib modules of python which you can install with the following command:
pip install scipy numpy matplotlib
The syntax of odeint functions is as follows:
odeint(func, y0, t, …..)
Parameters :
model– the differential equation
y0– Initial value of Y
t– the time space for which we want the curve(basically the range of x)
A lot more other parameters are there which you can check out in the documentation but these three parameters are the main ones.
Solving Differential Equations
Now let us solve some ODE with the help of the odeint function.
Example 1:
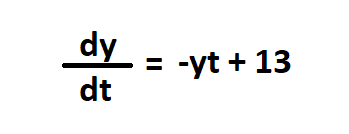
Ordinary Differential Equation
Python3
import numpy as np
from scipy.integrate import odeint
import matplotlib.pyplot as plt
def returns_dydt(y,t):
dydt = -y * t + 13
return dydt
y0 = 1
t = np.linspace(0,5)
y = odeint(returns_dydt, y0, t)
plt.plot(t,y)
plt.xlabel("Time")
plt.ylabel("Y")
plt.show()
|
Output:
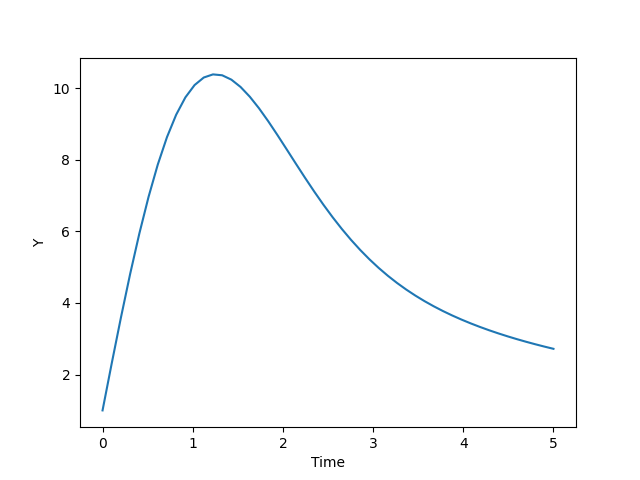
Graph for the solution of ODE
Example 2:
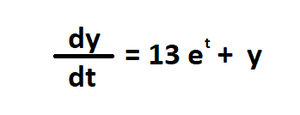
Ordinary Differential Equation
Python3
import numpy as np
from scipy.integrate import odeint
import matplotlib.pyplot as plt
def returns_dydt(y,t):
dydt = 13 * np.exp(t) + y
return dydt
y0 = 1
t = np.linspace(0,5)
y = odeint(returns_dydt, y0, t)
plt.plot(t,y)
plt.xlabel("Time")
plt.ylabel("Y")
plt.show()
|
Output:
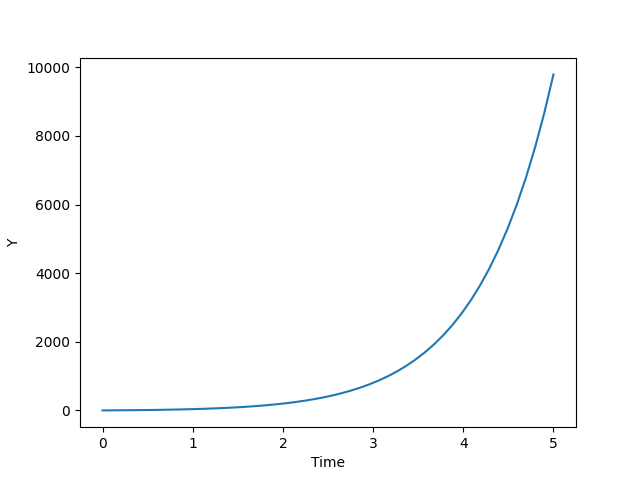
Graph for the solution of ODE
Example 3:
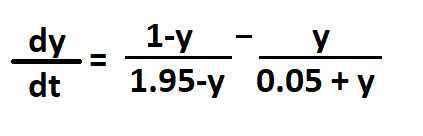
Ordinary Differential Equation
Let us try giving multiple initial conditions by making y0 an array.
Python3
import numpy as np
from scipy.integrate import odeint
import matplotlib.pyplot as plt
def returns_dydt(y,t):
dydt = (1-y)/(1.95-y) - y/(0.05+y)
return dydt
y0 = [0, 1, 2]
t = np.linspace(1,10)
y = odeint(returns_dydt, y0, t)
plt.plot(t,y)
plt.xlabel("Time")
plt.ylabel("Y")
plt.show()
|
Output:
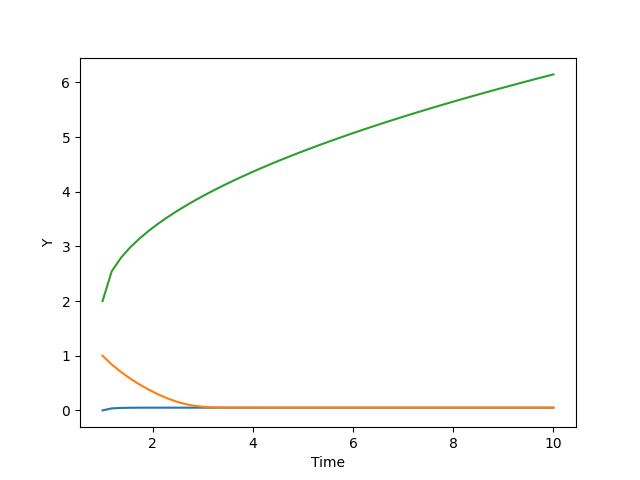
Graph for the solution of ODE
Share your thoughts in the comments
Please Login to comment...